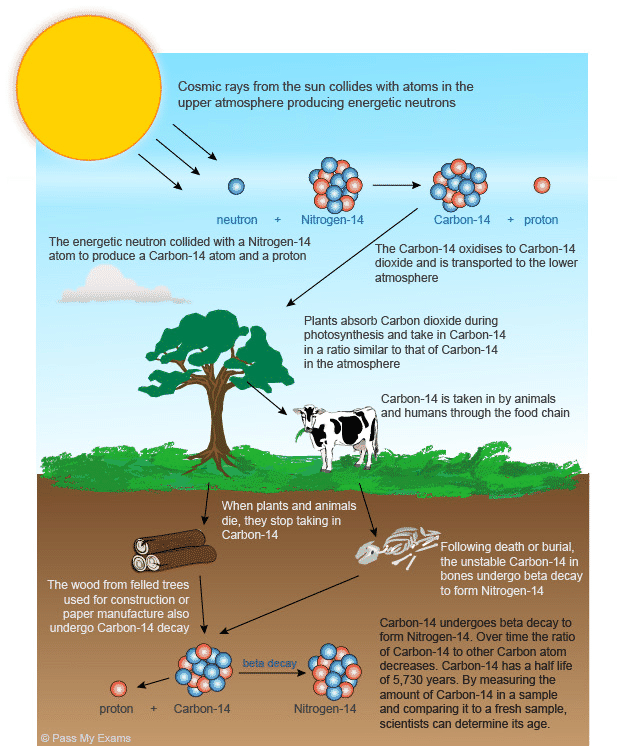
Below is from the website: http://hyperphysics.phy-astr.gsu.edu/hbase/nuclear/cardat.html
Homework 4 - part A
ECE 4339
Han Q. Le
(copyrighted) U. of Houston
In the following, you are welcome to use the APPs included to verify your answer, but you must show your work.
1. Carbon dating
We heard about carbon dating: archeologists
determine the ages of ancient objects by measuring the ratio of
carbon 14 vs. carbon 12. You can search the Internet about it, but
below is a short but very useful link to read:

Below is from the website:
http://hyperphysics.phy-astr.gsu.edu/hbase/nuclear/cardat.html

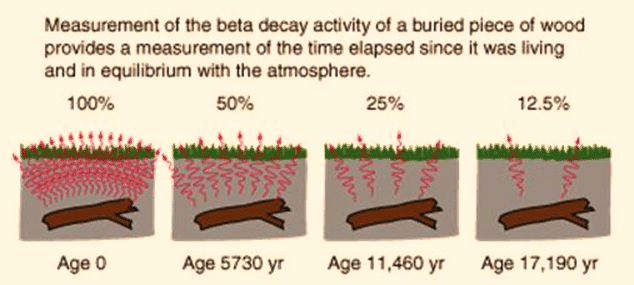
In the example above, if we see ![]() in a piece of wood is 50% of present value, the wood is 5,730 yr
old, and so on. We found an ancient remain with 32% of
in a piece of wood is 50% of present value, the wood is 5,730 yr
old, and so on. We found an ancient remain with 32% of ![]() relative to the present value, how old is that material?
relative to the present value, how old is that material?
APP: carbon dating
2. Moore’s law
Gordon Moore stated that “The number of transistors
incorporated in a chip will approximately double every 24 months.”
http://www.intel.com/content/www/us/en/history/museum-gordon-moore-law.html
Starting from 1970 with chip just ~ thousand transistors, in 40 years, we have 1,000,000,000 transistor chips by 2010. Apply Moore’s law, approximately what year did we have 500,000,000 transistor chips?
3. Moore’s law again
Watch APP How to find an exponential coefficient below to get help.
Moore’s law graph
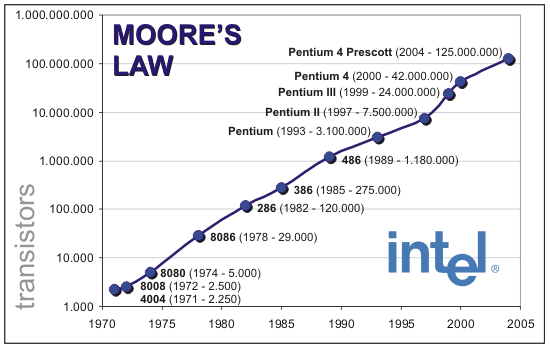
Work directly on the chart above (by drawing a best fit straight line), obtain the period for which the transistor count is double on a chip based on your best fit straight line and not from Moore’s statement. Show the value of the best-fit-line slope from which you derive the chip double period (this is the opposite of the half-life of carbon 14). Watch APP below if needed.
APP: How to find an exponential coefficient with the slope of a semilog plot
According the to data above, if you invested $10,000 in Apple in 2001, how much do you have now?
4. Interest and interest rate
You borrow $20,000 from a bank to buy a car with an annual interest rate of 6%, but is compounded monthly. You don’t have to pay for the first 3 years. Starting on the 4th years (after 36 months), how much do you owe the bank on the car loan?
APP: Loan or Investment yield
5. Mortgage
You borrow $24,000 from a bank to buy a car with an annual interest rate of 6%, compounded monthly. You pay back monthly M amount. What value is the value of M such that you pay off in 60 months? You can solve by doing the below:
5.1
Let P[n]
be your outstanding principal after the ![]() month of the loan. What is P[n+1]
immediately after you make your monthly payment?
month of the loan. What is P[n+1]
immediately after you make your monthly payment?
5.2
Derive a recursive formula to obtain an expression for P[n] based on P[0], interest rate r, and monthly payment M.
5.3
Solve for M by setting P[N]=0 where N is 60 (month).
5.4
What is the total amount of interest you pay over the lifetime of the loan?
HELP: APP: Mortgage calculator
APP: Mortgage calculator
6. Interest and investment
See APP Loan or Investment yield in problem 4 above.
6.1 Investment in SP500
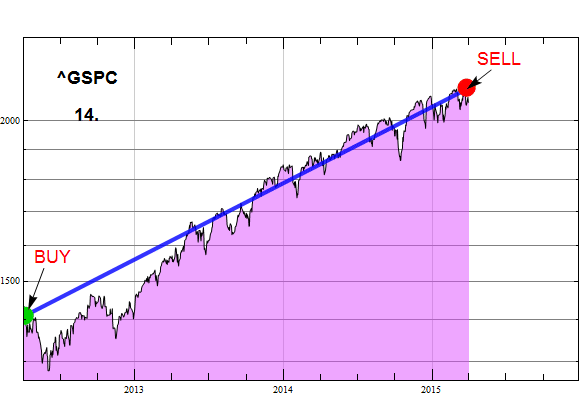
Suppose that 3 yr ago (March 2012), you borrow $20,000 with an annual interest rate of 6%, compounded monthly, but not to buy anything. Instead, you invest in an index fund that tracks SP500. After 3 years, the value of your investment is shown by the blue line below: it has a 14% annual rate of yield, but compounded continuously. Did you make a profit or lose money? and how much?
6.2 Investment in NASDAQ
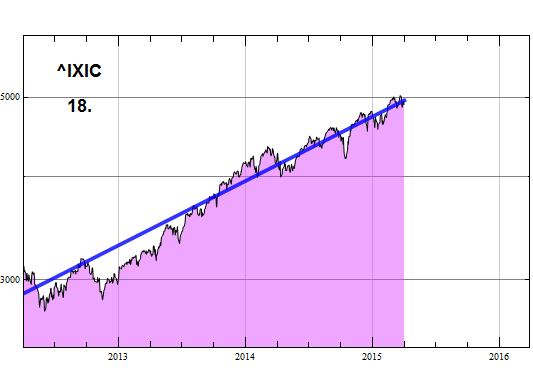
If, instead investing in SP500, suppose you invested in a NASDAQ fund instead, which has an 18% annual return rate (compounded continuously, of course) as shown below. How much profit or loss would you make with the $20,000 loan?
6.3 Long term investment
Suppose that the annual return rate is 18% (compounded continuously) is going on for many many years. How long will it take for your initial investment of $20,000 to become $1,000,000?
7. Electron and other particle lifetime
7.1 Electron population vs. time. (answer given)
In a semiconductor, excess electrons have a lifetime of 1.5 ns, write an expression (a mathematical formula) for its population as a function of time.
Answer
Its population can be described
as: ![]()
where ![]() is the population at time t=0, and τ=1.5 ns
is the population at time t=0, and τ=1.5 ns
7.2 Electron half-life
What is the electron half-life? (which is the time for which the population is reduced to half of the original)
7.3 Carbon 14 life-time
The half-life of carbon 14 is 5,370 yrs, can carbon 14 population be described with a formula like in 7.1? What is its lifetime τ?
7.4 Dirty bomb
A dirty bomb is also called RDD (a Radiological
Dispersal Device, see here: http://www.remm.nlm.gov/rdd.htm or
here: http://www.nrc.gov/reading-rm/doc-collections/fact-sheets/fs-dirty-bombs.html).
Several radioactive materials can be used. Calculate how it will
take for a contaminated area to have its radioactive material
reduced to 1% of its original amount for the following isotopes
with given 1/2-life:
Cobalt-60: 5.27 years
Strontium-90: 28.79 years
Caesium-137: 30.17 years
7.5 Nuclear accident
Suppose a nuclear accident happens and an amount of plutonium-238 (HL=87.7 years) is spewed. A measurement indicates that the amount in the contaminated area must be reduced by a factor of 200 to be safe. How long will it take for the area to be safe again?
8. Technology adoption
8.1 Early technology adopter exponential model
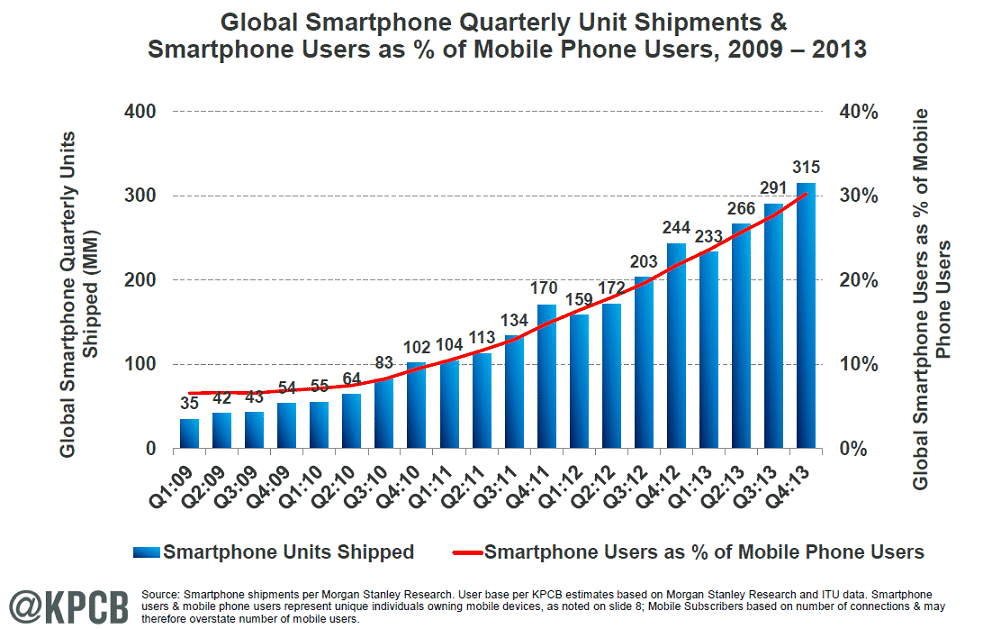
Below is the data of smartphone quarterly shipment
as a function of time. What is the annual growth rate of smart phone shipment
over a 4-yr period from 2009 to 2012? You can answer the
question by plotting the data on a semilog scale from Q1:09 to
Q4:12 (4-year period). From the log scale, determine the annual
adoption growth rate.
(see APP How to find an exponential
coefficient in Problem 3 for help).
8.2 Note: Early adoption growth model
Read for information and to review Fermi-Dirac distribution shape, no need to do anything.
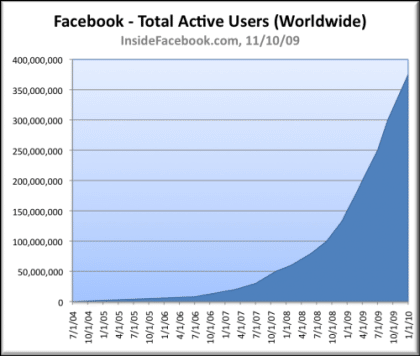
Early adoption growth tends to be exponential and the later trend is saturation (when everyone already has enough!). The behavior is very common throughout human history and the curve to describe it is call sigmoid curve (S-curve, etc.) , which is mathematically very similar to or of the same form as Ferm-Dirac distribution (reverse for growth)
APP: Sigmoid curve of new practice adoption and exponential growth model of early adopters
Fermi distribution for comparison
8.3 New technology adoption
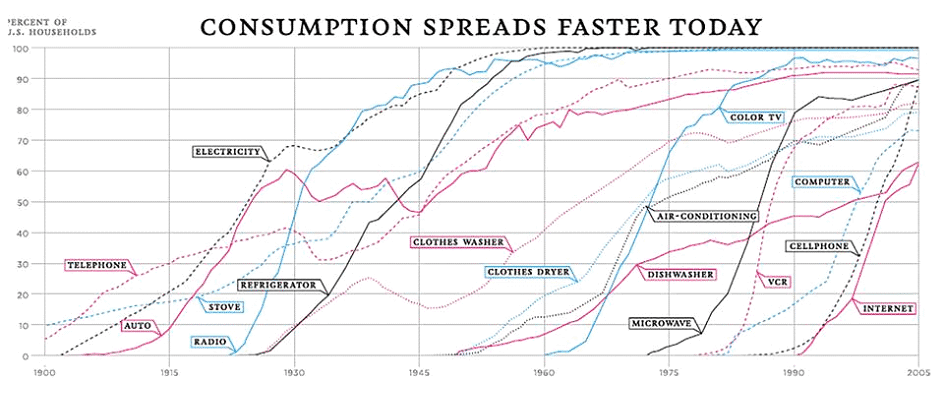
Pick 2 technologies in APP Sigmoid model fit for technology adoption of American households (below),fit with the S-curve to obtain mean time to adoption and the adoption annual growth rate.
APP: Sigmoid model fit for technology adoption of American households
9. Human mobility and diffusion length
See APP How to find an exponential coefficient in problem 3 above for help.
Refer to this paper:
http://www.nature.com/srep/2013/131018/srep02983/full/srep02983.html#close


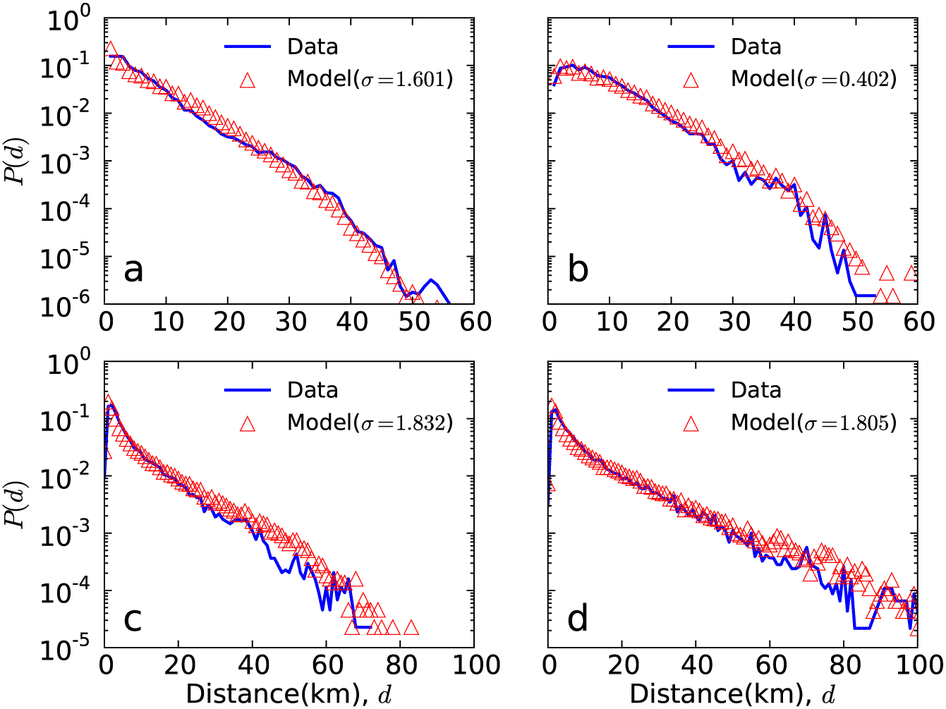
The blue solid lines denote the actual traveling distance distributions. The red triangles represent the trip-length distributions simulated by our model. (a)Beijing. (b)London. (c)Chicago. (d)Los Angeles.
9.1 Human “diffusion length”
If we treat the probability for trip length as a
representative of “human diffusion” capability tendency (how far
we can travel given our finite time and resource constraint),
calculated the “human diffusion length” of the four given cities
(Beijing, London, Chicago, Los Angeles) based on the given data.
Write an expression of P[d] as a function of d, given that:
 (or:
(or:
 , here, x or d is just a dummy variable)
See APP How to find an exponential coefficient in problem 3 above for help.
9.2 Human mobility
If we assume that the probability for trip length
is determined by human’s available time T and resource for travel, which also obeys an
exponential
distribution 
where ![]() is the mean time of travel, we can assume that people, regardless
where they live, budget approximately the same amount of time for
travel, just like people have approximately the same amount of
time for working, consuming food, entertaining etc.
is the mean time of travel, we can assume that people, regardless
where they live, budget approximately the same amount of time for
travel, just like people have approximately the same amount of
time for working, consuming food, entertaining etc.
If that is the case, then the diffusion length depends on the
average travel velocity which can be different for different
cities, depending on the mean of mobility (automobile, bicyle,
walking, etc.), the road infrastructure, the speed limit, the
number of police enforcing the speed limit, etc. Let ![]() ,
what is the average travel speed for each city?
,
what is the average travel speed for each city?
Additional reference:
10. Solar system planet distribution
10.1 Solar system planet distance from the Sun
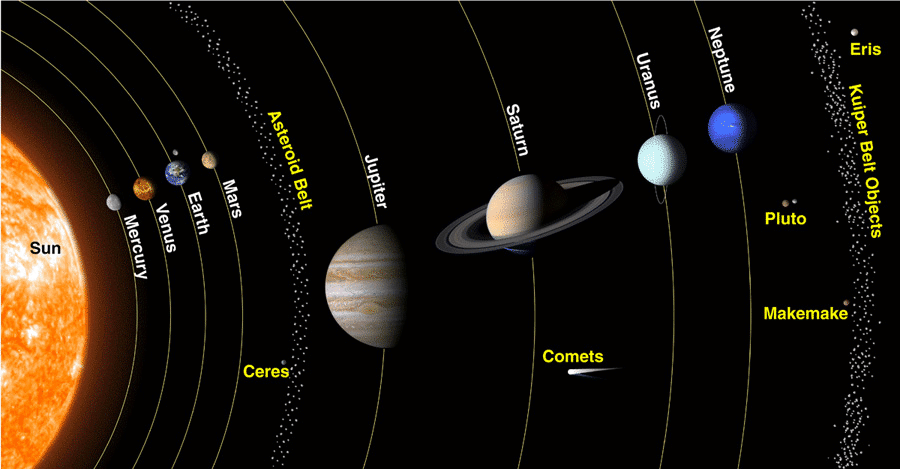
Assign the following number for the planets:
| Number | Planet | Distance from the Sun (Astronom. Unit) |
| 1 | Mercury | 0.39 |
| 2 | Venus | 0.72 |
| 3 | Earth | 1 |
| 4 | Mars | 1.52 |
| □ | □ | □ |
| 6 | Jupiter | 5.20 |
| 7 | Saturn | 9.54 |
| 8 | Uranus | 19.19 |
| 9 | Neptune | 30.11 |
| 10 | Pluto | 39.5 |
![]()
Below is the linear plot of the planet distance from the Sun

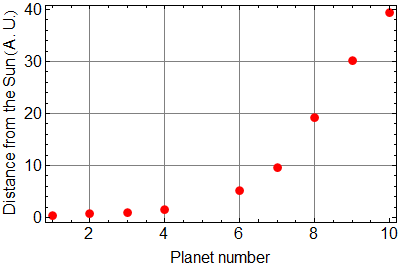
Plot the same data but on Log plot. What can you
conclude about the planet distance from the Sun? (Can you write a
formula
![]()
where ![]() is the distance of the
is the distance of the ![]() planet from the Sun?)
planet from the Sun?)
(see: http://www.astro.cornell.edu/academics/courses/astro201/bodes_law.htm)