Tutorial 2.5
Generic ECE - University of Houston
Han Q. Le (c) Copyrighed
The objective of this tutorial to see how lists and arrays are used in common examples. Practice by creating your own similar example and have fun,
1. Multi-object personal data record
Exercise 1.5 Create a list of your personal data as shown below
If you have problem of recording with the microphone, chances are system doesn’t allow other apps to access the microphone. Google search how to allow apps access your microphone for your OS (e. g. Windows or Mac). Do same with camera.
Answer (replace the below with your info - do at home)
The takeaways: the concept of data record and database structure.
Google search datarecord and database
2. Learn to import file: gif and graphics
Do the exercise in Tutorial_2_answer section 3.3, exercise 3.8. Make sure you have output gif file “emwave.gif” already on your laptop and bring the file to the class. Then, you will follow instructions what to do with it in class. This is what one frame of the file should look like:
Out[2]=
2.1 Import file data as List
In[3]:=
![]()
In[45]:=
![]()
Out[45]=
![]()
In[4]:=
2.2 Add/modify graphics
In[67]:=
In[68]:=
![]()
Out[68]=
![]()
3. Exercise with list, array: sound
3.1 Make a tune
Given:
Answer
In[1]:=
Out[9]=
In[2]:=
Out[2]=

The takeaways: How to get and look up reference info, data.
3.2 Use function Map.
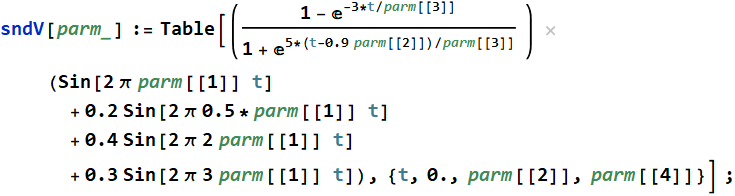
We can define a function to generate a sound signal. Then use Map to play from a list.
Out[51]=
In[13]:=
In[14]:=

Out[15]=
In[3]:=
Out[3]=
4. Exercise with list, array: illustration
See this graphics on the course webpage: social_media _market _share.
A few students were able to do it couple years ago with less than
one week intense-training on Mathematica that they had never
learned before (but they were proficient in Python and programming
in general). Do you think you can do it? Just write your thinking
how you would go about to do something like it.
5. Exercise with list, array: graphics 1
to be done in class
In[1]:=
![]()
Out[1]=
In[2]:=
Out[3]=
In[32]:=
In[8]:=
Out[9]=
In[10]:=
Out[11]=
In[16]:=
Out[17]=
The takeaways: Use indexed variables - as opposed to fixed numbers
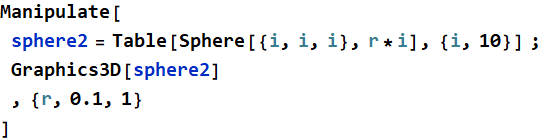
6. Exercise with list, array: graphics 2 - animation
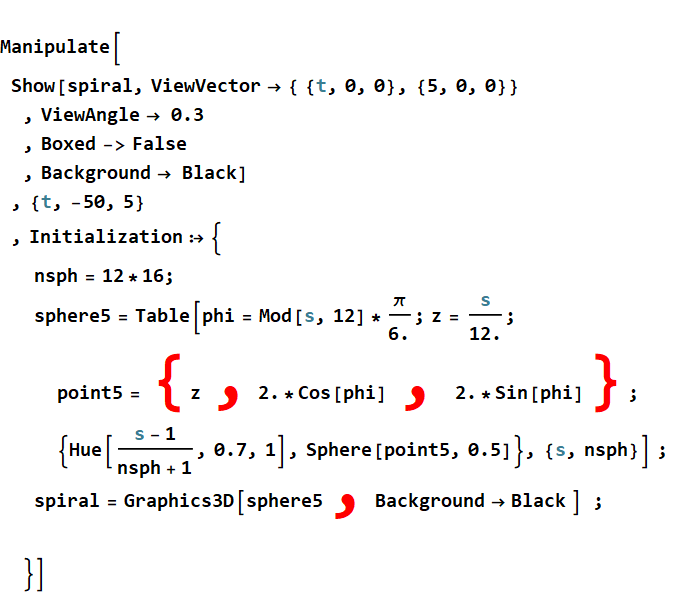
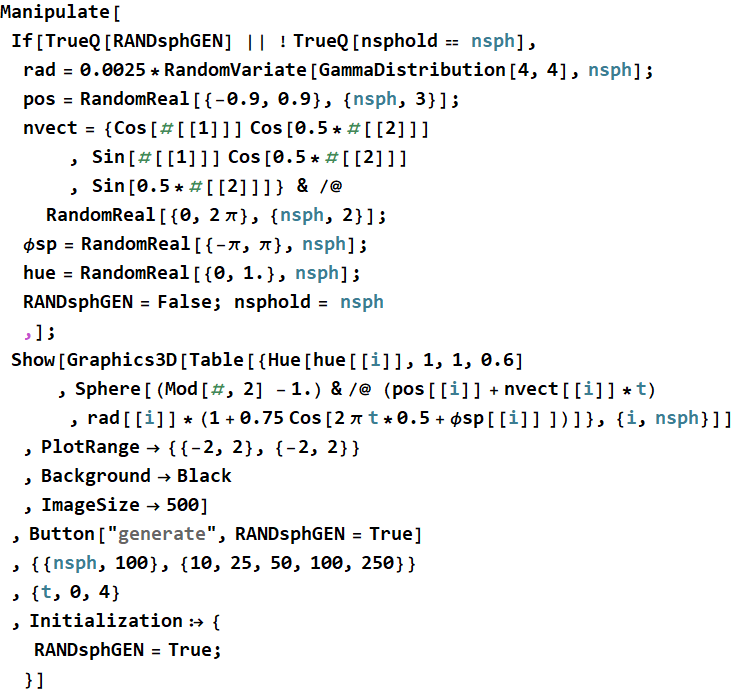
6.1 A spiral of spheres
Out[25]=
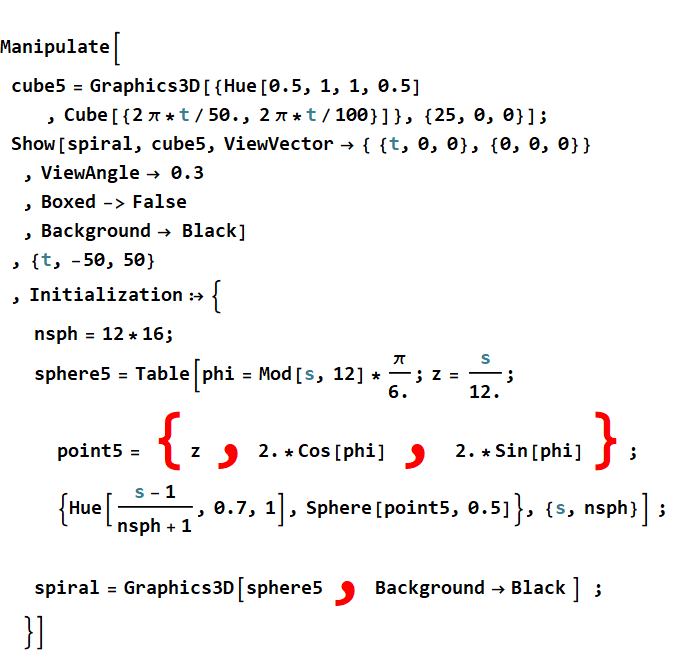
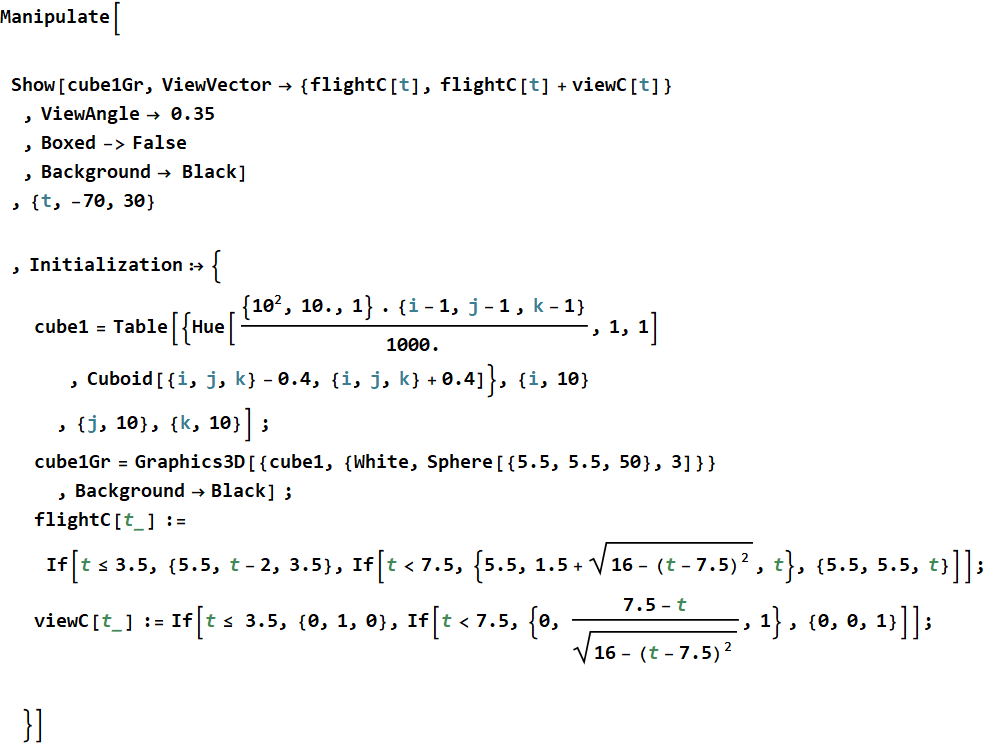
6.2 Animation with a time parameter
In[38]:=
Out[38]=
In[3
9]:= 
Out[39]=
In[40]:= 
Out[4
0]= 
The takeaways: Use indexed variables for animation, manipulation
In[88]:=
Out[88]=
![]()
7. Exercise with list, array: graphics 3
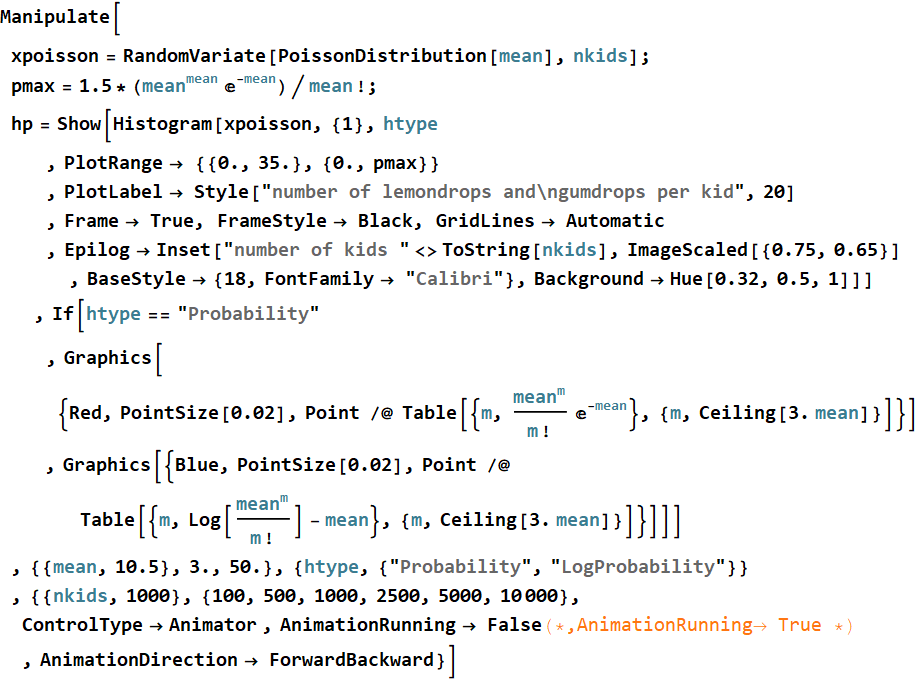
Monte Carlo demo of Poisson distribution
7.1 Problem set up:
First, a description of the background.
https://www.youtube.com/watch?v=Sh1ZeWhAtRI
Exercise 7.1
Let’s assume that all the raindrops were lemondrops
and gumdrops, and the kids all stood outside with mouths open
wide. Assume that all the kids have mouth of the same size: 3-in
diameter, what is the mouth area (in ![]() )?
)?
Answer
In[118]:=
Out[119]=
![]()
or 7 ![]() .
.
Exercise 7.2
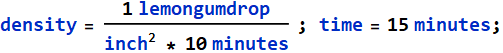
Let the lemon/gumdrops density is ![]() per 10 minutes. If we have 100 kids all stand outside with mouth
open wide for 15 minutes, how many lemon or gumdrops would each
kid catch? Wait, will everyone get exactly the same number of
candies? No, some will get more, some will get less.
per 10 minutes. If we have 100 kids all stand outside with mouth
open wide for 15 minutes, how many lemon or gumdrops would each
kid catch? Wait, will everyone get exactly the same number of
candies? No, some will get more, some will get less.
We should ask, what is the average number of candies that each kid
can catch?
Answer
In[120]:=
Out[121]=
![]()
7.2 Monte Carlo simulation of a random process
The average is 10.6 candies. But does that mean every kid would get exactly 10.6 lemon/gumdrops? If we count the number of “raindrops” each kids get, and tabulate on a histogram, do they all get 10, 11? or would some get 5, other would get 15 etc... Is it possible for some to get 20?
How do you
answer the questions above. Or could it be that it doesn’t have an
answer? If you have several groups of 10,000 kids each. Would
there be any resemplance of their histograms? or will it be
totally random for each group and all the histograms are
different?
In the follow, you should follow the guidelines to gain an
understanding and see if you can answer those questions at the
end.
7.2.1 Background
One way to study this problem is the Monte Carlo method:
7.2.2 Approach
We can use the computer to simulate 100 kids’ mouths and rain drops. First, set up the mouths:
Exercise 7.3
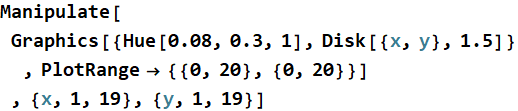
Let's make the mouth to be a circle (disk). Let' s assume the kids line up in 10 rows x 10 columns. Generate a graphics for the mouths, using Disk:
In[126]:=
Answer
In[127]:=
Out[127]=
 |
|
The left handside is the model of the right handside that is easier for counting (lest the right hand side swallow lemon/gumdrops before we finish counting).
Next, let’s simulate lemongumdrops:
Exercise 7.4
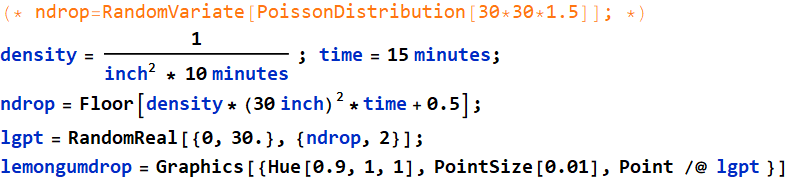
Calculate the expected number of candies falling in
a square of 30 x 30 ![]() in 15 minutes using the density given below. Denote that as ndrop,
then generate ndrop number of points (each point is a candy)
with {x, y} coordinates in that 30x30 square, using RandomReal[].
in 15 minutes using the density given below. Denote that as ndrop,
then generate ndrop number of points (each point is a candy)
with {x, y} coordinates in that 30x30 square, using RandomReal[].
Answer
In[134]:=
Out[137]=
Exercise 7.5
Now, let’s see who catch what by putting mouths and lemongum raindrops together:
In[138]:=
![]()
Out[138]=

Count the number of candies falling in each mouth for all mouths.
Answer
We will count for each mouth by using this:
In[143]:=
Out[146]=
 |
 |
There we have it. Some are very lucky with many, some are the opposite.
7.3 Histogram of candies - demo only
Out[147]=
|
|
We see that the lucky one could catch 6 times more than the unlucky one. The mean is:
In[148]:=
![]()
Out[148]=
![]()
OK, this is what you should do. Use the code below
(you don’t have to understand it at this point - later in the
course, you will - just use it for now) be simulate and obtain
histograms for 400 kids each time (improve our statistics with
larger sampling population). Do it several times (your choice) and
add themt to get more statistics until you feel confident in your
answers:
- What is the chance for a kid to get only 4 lemon/gumdrops? (of
course, under the same condition: ![]() per 10 minutes and the kid stands for 15 minutes.
per 10 minutes and the kid stands for 15 minutes.
- what is the chance to get exactly
10? (many think it is about 50%-50% and that is very wrong).
- what is the chance to get 15 and 20, respectively
- show your histograms.
It’s much faster if we use square mouth instead of round mouth. Here is the code for 2500 kids (50 by 50)
In[52]:=
your answer is in array catch1. The total is in total. It is up to you to plot. You can copy and paste the code above to run in your file, but you cannot copy and paste the code to plot the histogram below, because the purpose of this exercise is for you to remember the syntax of Histogram function by typing it yourself even if you have to look at the example character by character. Of course, you should always use the Help part of Mathematica.
In[60]:=

Out[60]=
This distribution is called Poisson distribution. You can read up an interesting application during WW2 when the British tried to determine if German V-1 and V-2 bombers were sufficiently accurate navigationally to target high-value facilities: https://www.britannica.com/topic/Poisson-distribution
This is another demo: you can see the distribution
reaches certain shape as n-> 10,000. That shape is 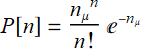
In[1]:=
Out[1]=
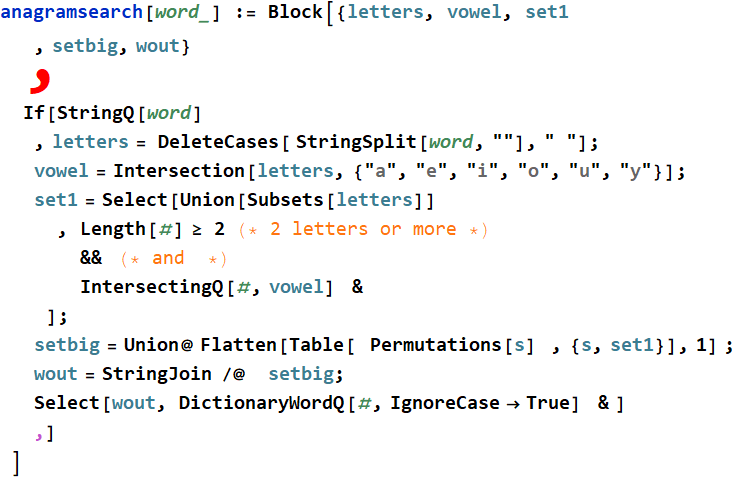
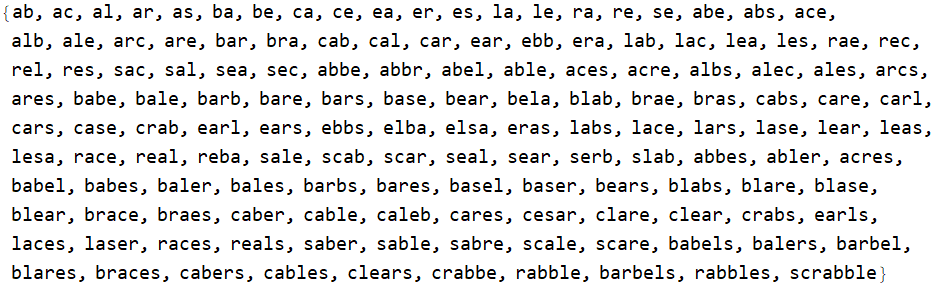
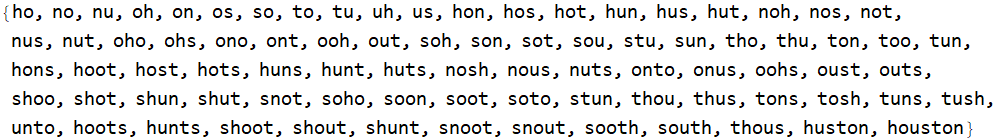
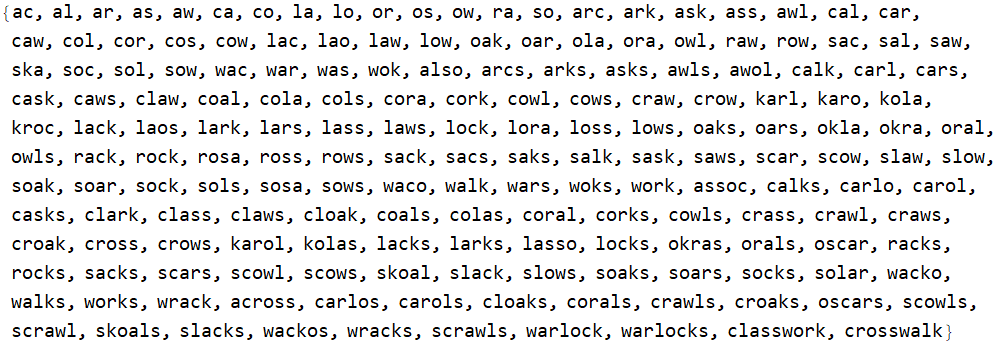
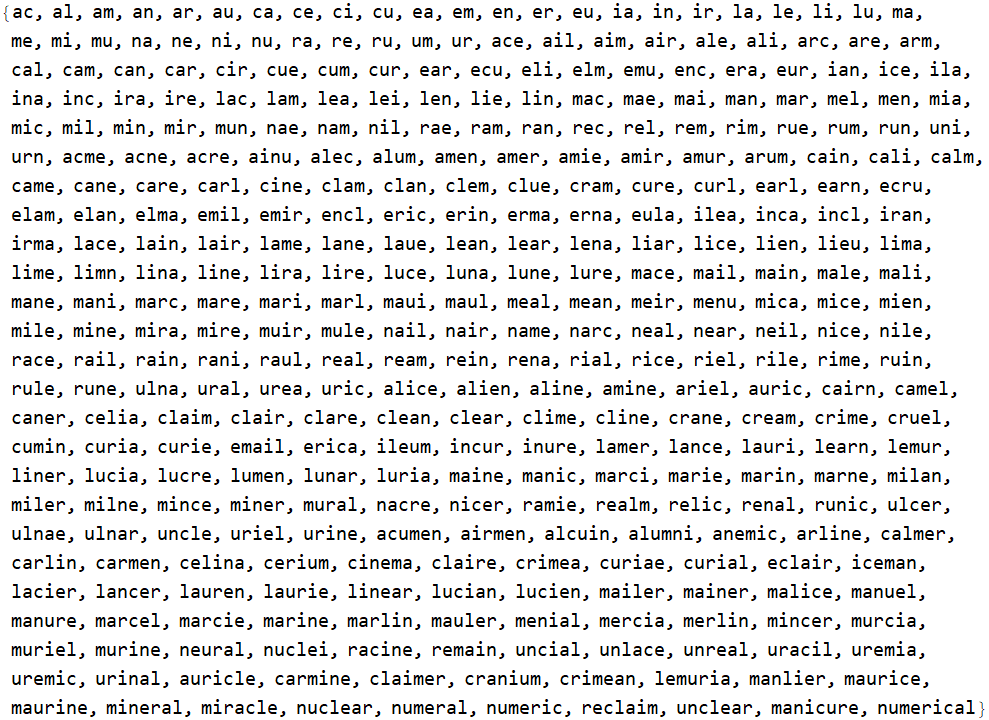
8. Exercise with list, array: strings
In[85]:=
In[86]:=
![]()
Out[86]=
In[235]:=
![]()
Out[235]=
In[237]:=
![]()
Out[237]=

In[236]:=
![]()
Out[236]=
In[22]:=
![]()
Out[22]=
In[127]:=
Out[129]=
| Full |
|
||||||||||||||||||||||||||||||||||||||||||||||||||||||||||||||||||||||||||||||||
| many |
|
||||||||||||||||||||||||||||||||||||||||||||||||||||||||||||||||||||||||||||||||
| glorious |
|
||||||||||||||||||||||||||||||||||||||||||||||||||||||||||||||||||||||||||||||||
| morning |
|
||||||||||||||||||||||||||||||||||||||||||||||||||||||||||||||||||||||||||||||||
| have |
|
||||||||||||||||||||||||||||||||||||||||||||||||||||||||||||||||||||||||||||||||
| seen |
|