ECE3340 Numerical Methods |
|
||
Class blog 2/21
ECE 3340 - Han Q. Le (c)
Help for HW 3 and classwork.
1. Linear regression of Fourier harmonics
Consider this:
Suppose we have measured various dominant
frequencies from 1 to 20 and put into a paired list.
(to pair, use Transpose[{Range[Length[fList],fList}]
Out[27]=
| {1,119.011} | {2,238.022} | {3,357.032} | {4,475.043} | {5,594.054} |
| {6,713.565} | {7,831.45} | {8,951.086} | {9,1069.1} | {10,1188.11} |
| {11,1305.62} | {12,1431.13} | {13,1549.14} | {14,1660.15} | {15,1787.16} |
| {16,1898.17} | {17,2026.18} | {18,2136.19} | {19,2264.21} | {20,2375.22} |
What we can do to find the fundamental harmonic is to do a linear regression. First, let’s plot the data:
In[28]:=
![]()
Out[28]=
We want to fit a straightline through them, this is how we can do it:

Out[39]=
![]()
In[40]:=
![]()
Out[40]=
![]()
Let’s check by plotting the fitting on top of the data:
In[41]:=
![]()
Out[41]=
Quite a good fit, isn’t it? There is a parameter (that we will learn later on), called R-squared that indicates how good the fit is:
In[42]:=
![]()
Out[42]=
![]()
Well, 1 is perfect, so this is quite remarkable. Don’t expect to always get this. 0.999 is quite good and that's all expected from HW.
In[43]:=
![]()
Out[43]=
![]()
and we can plot:
In[38]:=
Out[38]=
We can also plot the relative residuals:
In[45]:=

Out[45]=
In other words, the deviation is <= 0.3%.
2. Find Fourier coefficients
There are a number of algorithms with increasing
sophistication and accuracy, but here, we will use the simplest
and quickest: nearest maximum.
Besides data and sampling rate, we need a list of the number of
dominant harmonics, such as {2, 3, 6, 11, 8, 9, 7...}. It doesn’t
have to contain every integer in a range. For example, a signal
with a very weak 5th harmonic may not need the coefficient for
m=5. However, if it is too bothersome having to select which one
to include, which one to exclude, one can include the entire range
if the added extra noises or interference are insignificant.
Hence, one can just stipulate a range in low noise signals. Also,
numeric order is not important. In fact, it can go from the
highest to the lowest power harmonic in descending order, for
example.
Go to Section 4 below to see utility function findFourier0
Below to an example:
In[102]:=
![]()
Proof-in-the-pudding how good the harmonic linear regression is evident in the graph below.
In[95]:=
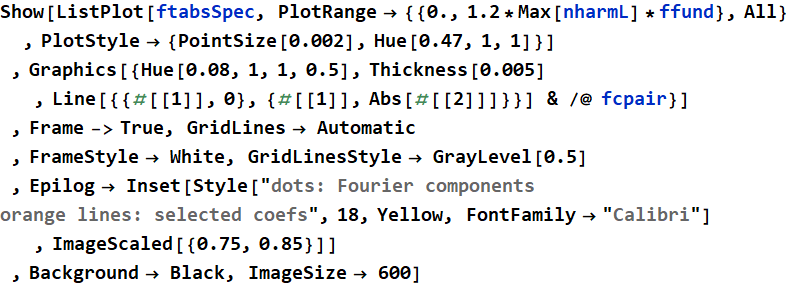
Out[95]=
We can see on dB scale:
In[111]:=
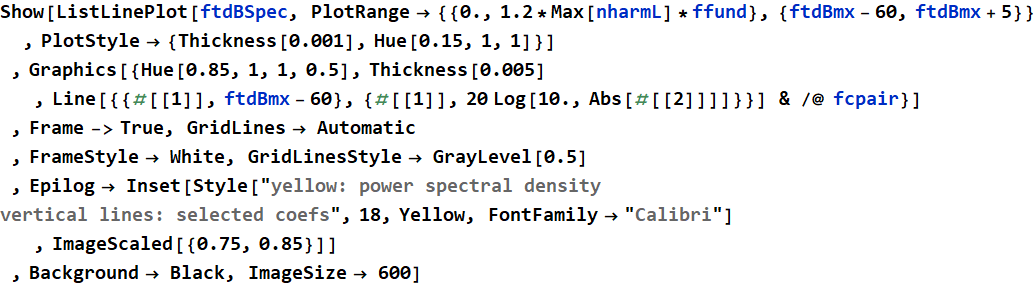
Out[111]=
See the updated
version of this note in the .nb
file that shows how to plot your selected harmonics.
3. How to generate and obtain a clean spectrum
Will be discussed in class. Examples will also be shown.
4. General utility functions
4.1 Utility software for HW 3 - problem 1
In[10]:=
4.2 Generate music
Example