ECE3340 Numerical Methods |
|
||
Classwork 3/26 - solutions
US Covid-19 data analysis
ECE 3340 &
generic Han Q. Le (c)
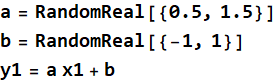
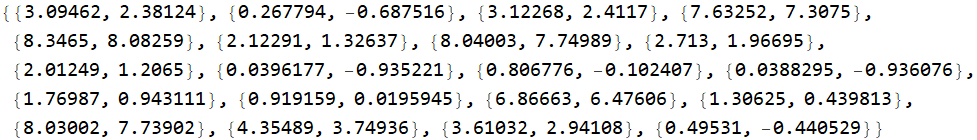
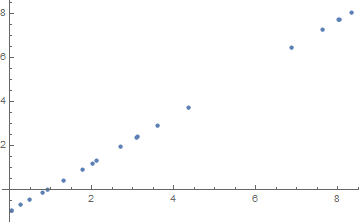
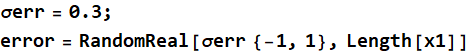
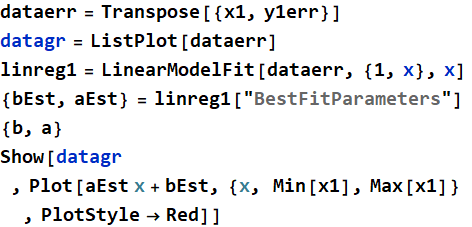
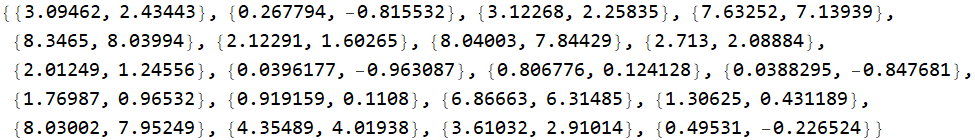
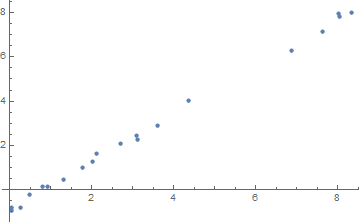
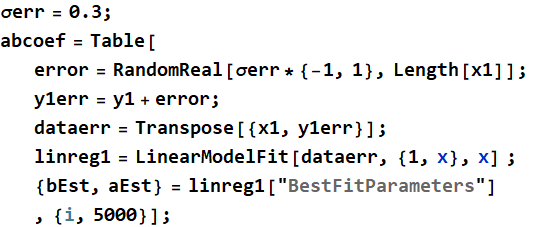
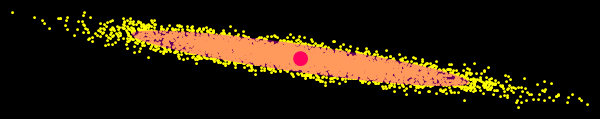
Q. 1 Linear regression of simulated data
In[3]:=
![]()
Out[3]=

We want to create a variable y1= a x1 +b
In[4]:=
Out[4]=
![]()
Out[5]=
![]()
Out[6]=

![]()
Out[5]=
![]()
Out[6]=
In[7]:=
Out[8]=

In[9]:=
![]()
Out[9]=

In[10]:=
Out[10]=
Out[11]=
Out[12]=
![]()
Out[13]=
![]()
Out[14]=
![]()
Out[15]=
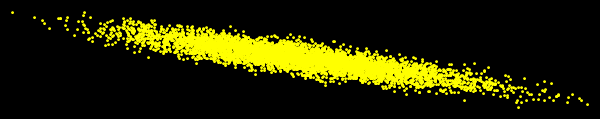
Q. 2 Estimates of coefficients
In[7]:=
In[45]:=
![]()
In[21]:=
Out[21]=
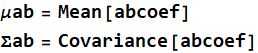
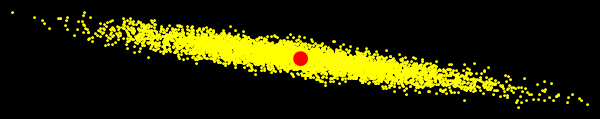
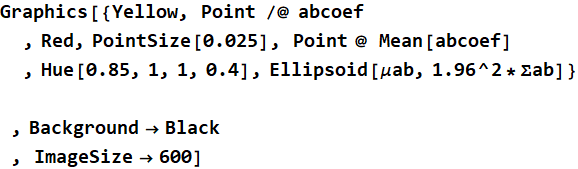
Q. 3 Estimate coefficients: descriptive statistics
In[10]:=
Out[10]=
![]()
Out[11]=
![]()
In[12]:=
![]()
Out[12]=
In[13]:=
Out[13]=
In[14]:=
Out[14]=
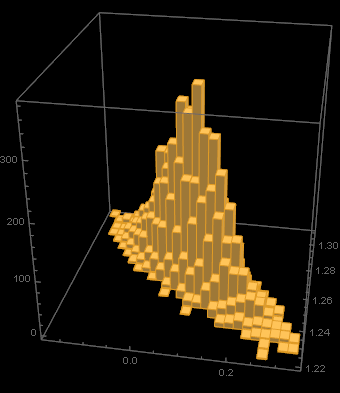
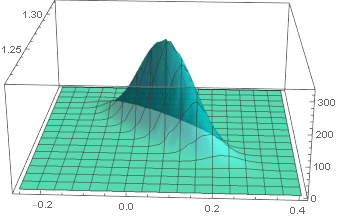
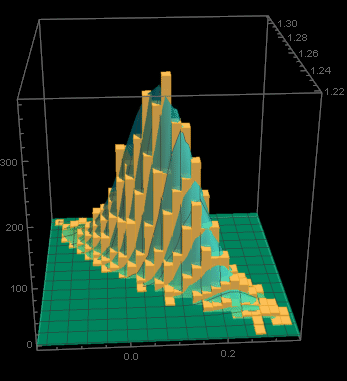
Q. 4 Estimate coefficients: Histogram and model
In[15]:=
Out[19]=
In[22]:=
![]()
Out[22]=
Data covid
In[23]:=

In[26]:=
![]()
Out[26]=
![]()
In[24]:=

In[26]:=
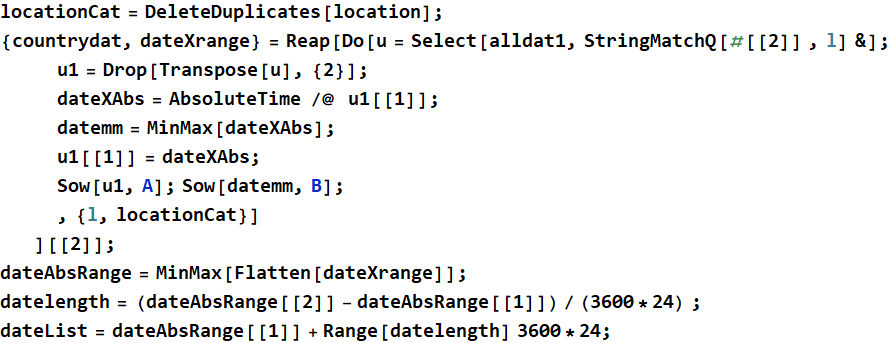
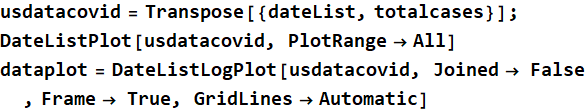
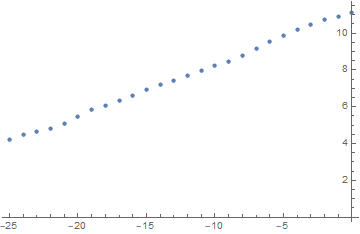
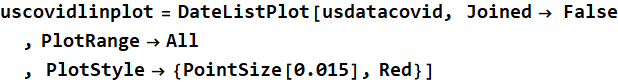
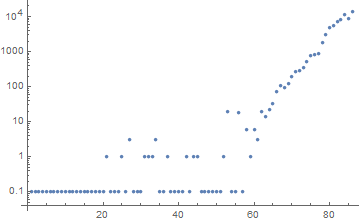
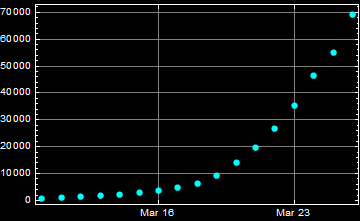
Q.5 US Covid data
In[31]:=

Out[31]=
![]()
In[54]:=
Out[55]=
Out[56]=
In[36]:=
![]()
Out[36]=
![]()
In[37]:=
![]()
Out[37]=
![]()
In[47]:=
In[49]:=
![]()
Out[49]=
In[50]:=
![]()
Out[50]=
![]()
In[51]:=
![]()
Out[51]=
![]()
In[57]:=
Out[57]=
In[53]:=
![]()
Out[53]=
![]()
In[58]:=
Out[58]=
In[59]:=
Out[59]=
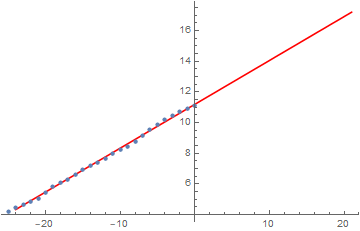
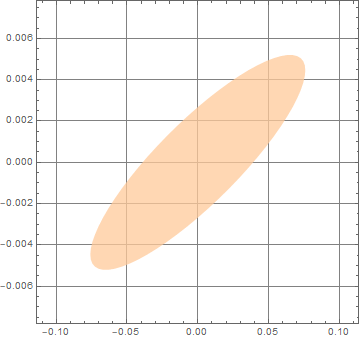
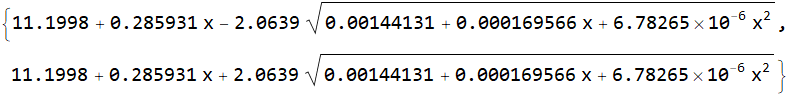
Q.6 Confidence of the estimates
In[33]:=
![]()
Out[33]=
In[41]:=
![]()
Out[41]=
| Estimate | Standard Error | t-Statistic | P-Value | |
| 1 | 11.2092 | 0.0416336 | 269.235 | 9.58726*10^^-42 |
| x | 0.286483 | 0.00280058 | 102.294 | 4.35642*10^^-32 |
In[60]:=
![]()
Out[60]=
![]()
In[61]:=
![]()
Out[61]=
![]()
In[62]:=
![]()
Out[62]=
![]()
In[63]:=
Out[63]=
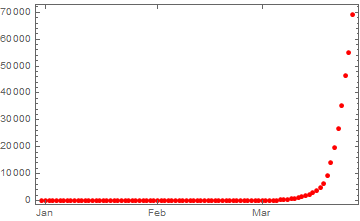
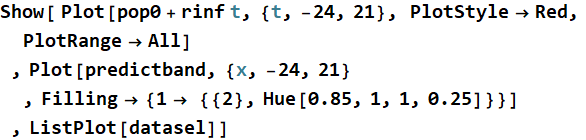
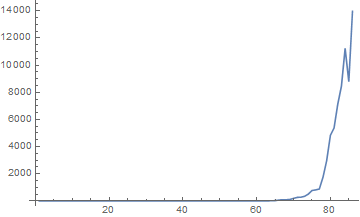
Q.7 Projection
In[64]:=
![]()
Out[64]=
In[65]:=
Out[65]=
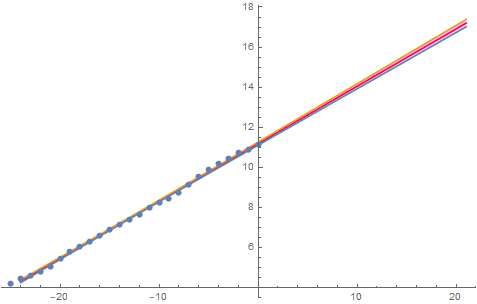
In[83]:=
Out[83]=
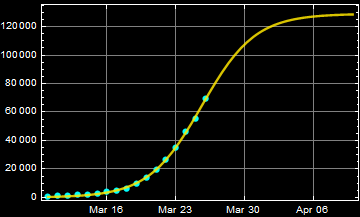
| Estimates of infected
population in the US (if no preventive measure and same infection rate) |
||||||||||||||||||||||||
|
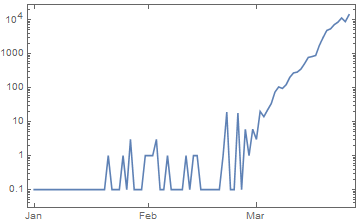
Q.8 Trend
Daily trend
In[84]:=
![]()
Out[84]=

In[85]:=
![]()
Out[85]=
In[86]:=
![]()
Out[86]=
In[87]:=
![]()
Out[87]=
In[88]:=

Out[89]=
In[90]:=

Out[91]=
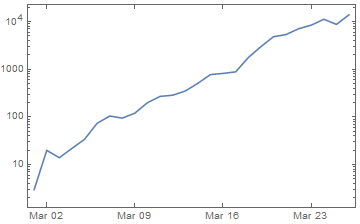
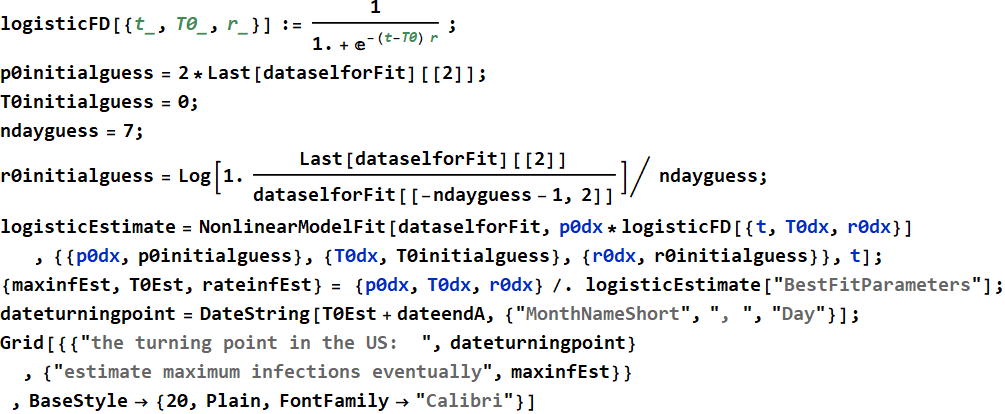
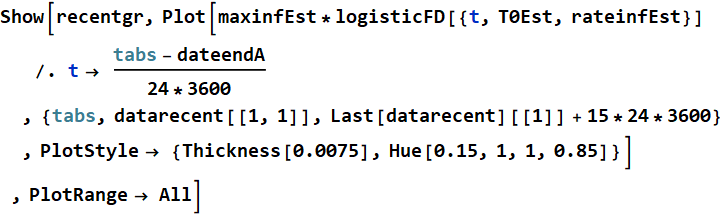
For HW - Logistic curve fit for most recent total cases
Out[91]=

Is the slight curvature significant? Consider
model: ![]()
We can fit to the most recent trend to see if the bend over is
real
In[114]:=
In[207]:=
Out[207]=
In[236]:=
Out[244]=
| the turning point in the US: | Mar, 25 |
| estimate maximum infections eventually | 129084. |
In[216]:=
Out[216]=
In[218]:=
![]()
Out[218]=
![]()
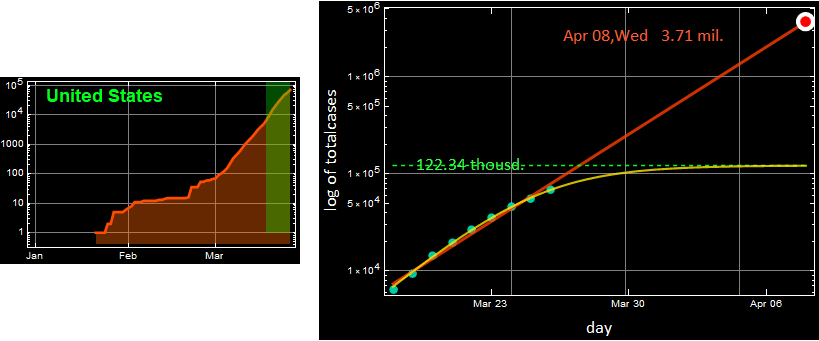
For the best case scenario, the maximum infection in the US will max out between 108 K and 150 K if the bending trend in recent data is true. Below is the equivalent graph on the App (Log scale)
Q.9 Spatial Laplace distribution
Link to HW 5