Tutorial 3 - Linear Algebra 1
generic ECE - U. Houston
Han Q. Le (c) copyrighted
1. Vector dot (inner) product
1.1 Example 1
Consider this data:
Out[10]=
| Trip category | A | B | C | D | E | F | G |
| # of trips | 5 | 2 | 6 | 3 | 3 | 1 | 4 |
| mileage/trip | 1052 | 740 | 576 | 1380 | 824 | 10850 | 438 |
Exercise 1.1
Define variable ntrip that contains data of the first row, and mileage that contains the data in the second row. Then find the total frequent-flyer mileage.
Answer
Out[13]=
![]()
END exercise
In the above, we see that any one-D array can be considered as a vector in space (linear algebra concept). The length of the array is the dimension of the space.
What we learn above with vector ntrip and mileage is their �dot product�, one of the MOST frequent and useful math operations of array data.
Consider this example: one has a number of shares of various stock shareX at priceX, what is the value of each stock and what is the net value?
In[27]:=
Out[28]=
![]()
Out[29]=
![]()
In[30]:=
![]()
Out[30]=
![]()
The dimension of the space of priceX is 4.
1.2 Dot product
The operation between 2 arrays:
![]() and
and ![]()
![]()
as mentioned, a most common operation in computer calculation of
arrays, is mathematically formally defined as the dot product:
![]()
where x array and y array are considered as
vectors.
In all higher-level language, using function dot means we can skip step in more basic language, such as using do loop:
In[1]:=
![]()
Out[4]=
![]()
The trend of computing is to create more and more built-in high-level functions such that the user can obtain results with less and less programming effort. Mathematica, Matlab, high-level library and special packages (R, Spyder) in Python, etc. are designed toward this goal.
Examples of dot product are abound and common in spreadsheet calculations. In fact, even the sum (total) of an array is considered as the dot product of the array and vector {1,1,1,...}.
Here is a common application:
In[34]:=
Out[37]=
![]()
Out[42]=
|
||||||||||||||||||||
|
Below is what we learn about dot product between physical vector in 2 D space:
In[8]:=
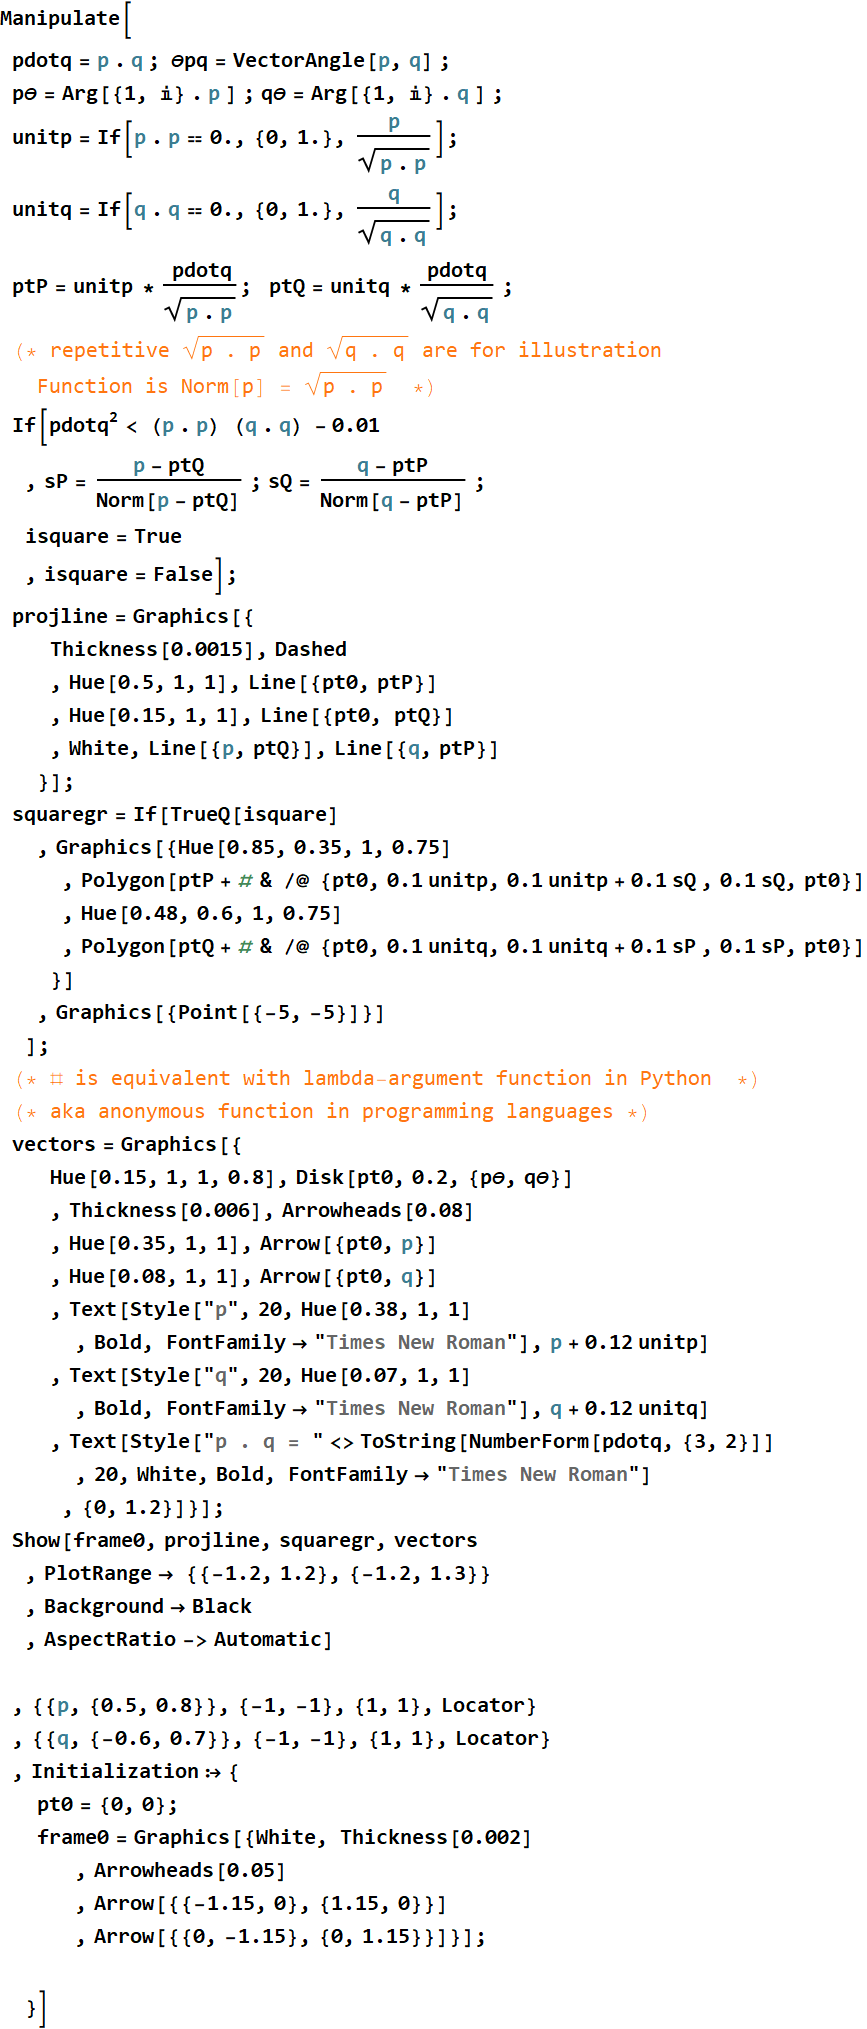
Out[8]=
Exercise 1.2
Consider a circuit with n devices, make your choice of n between 5 and 8. Generate arrays of the device voltages and currents (your choice of values). Find the net power consumption of all devices.
Answer
In[109]:=
Out[109]=
![]()
Out[110]=
![]()
Out[111]=
![]()
Out[112]=
![]()
Out[113]=
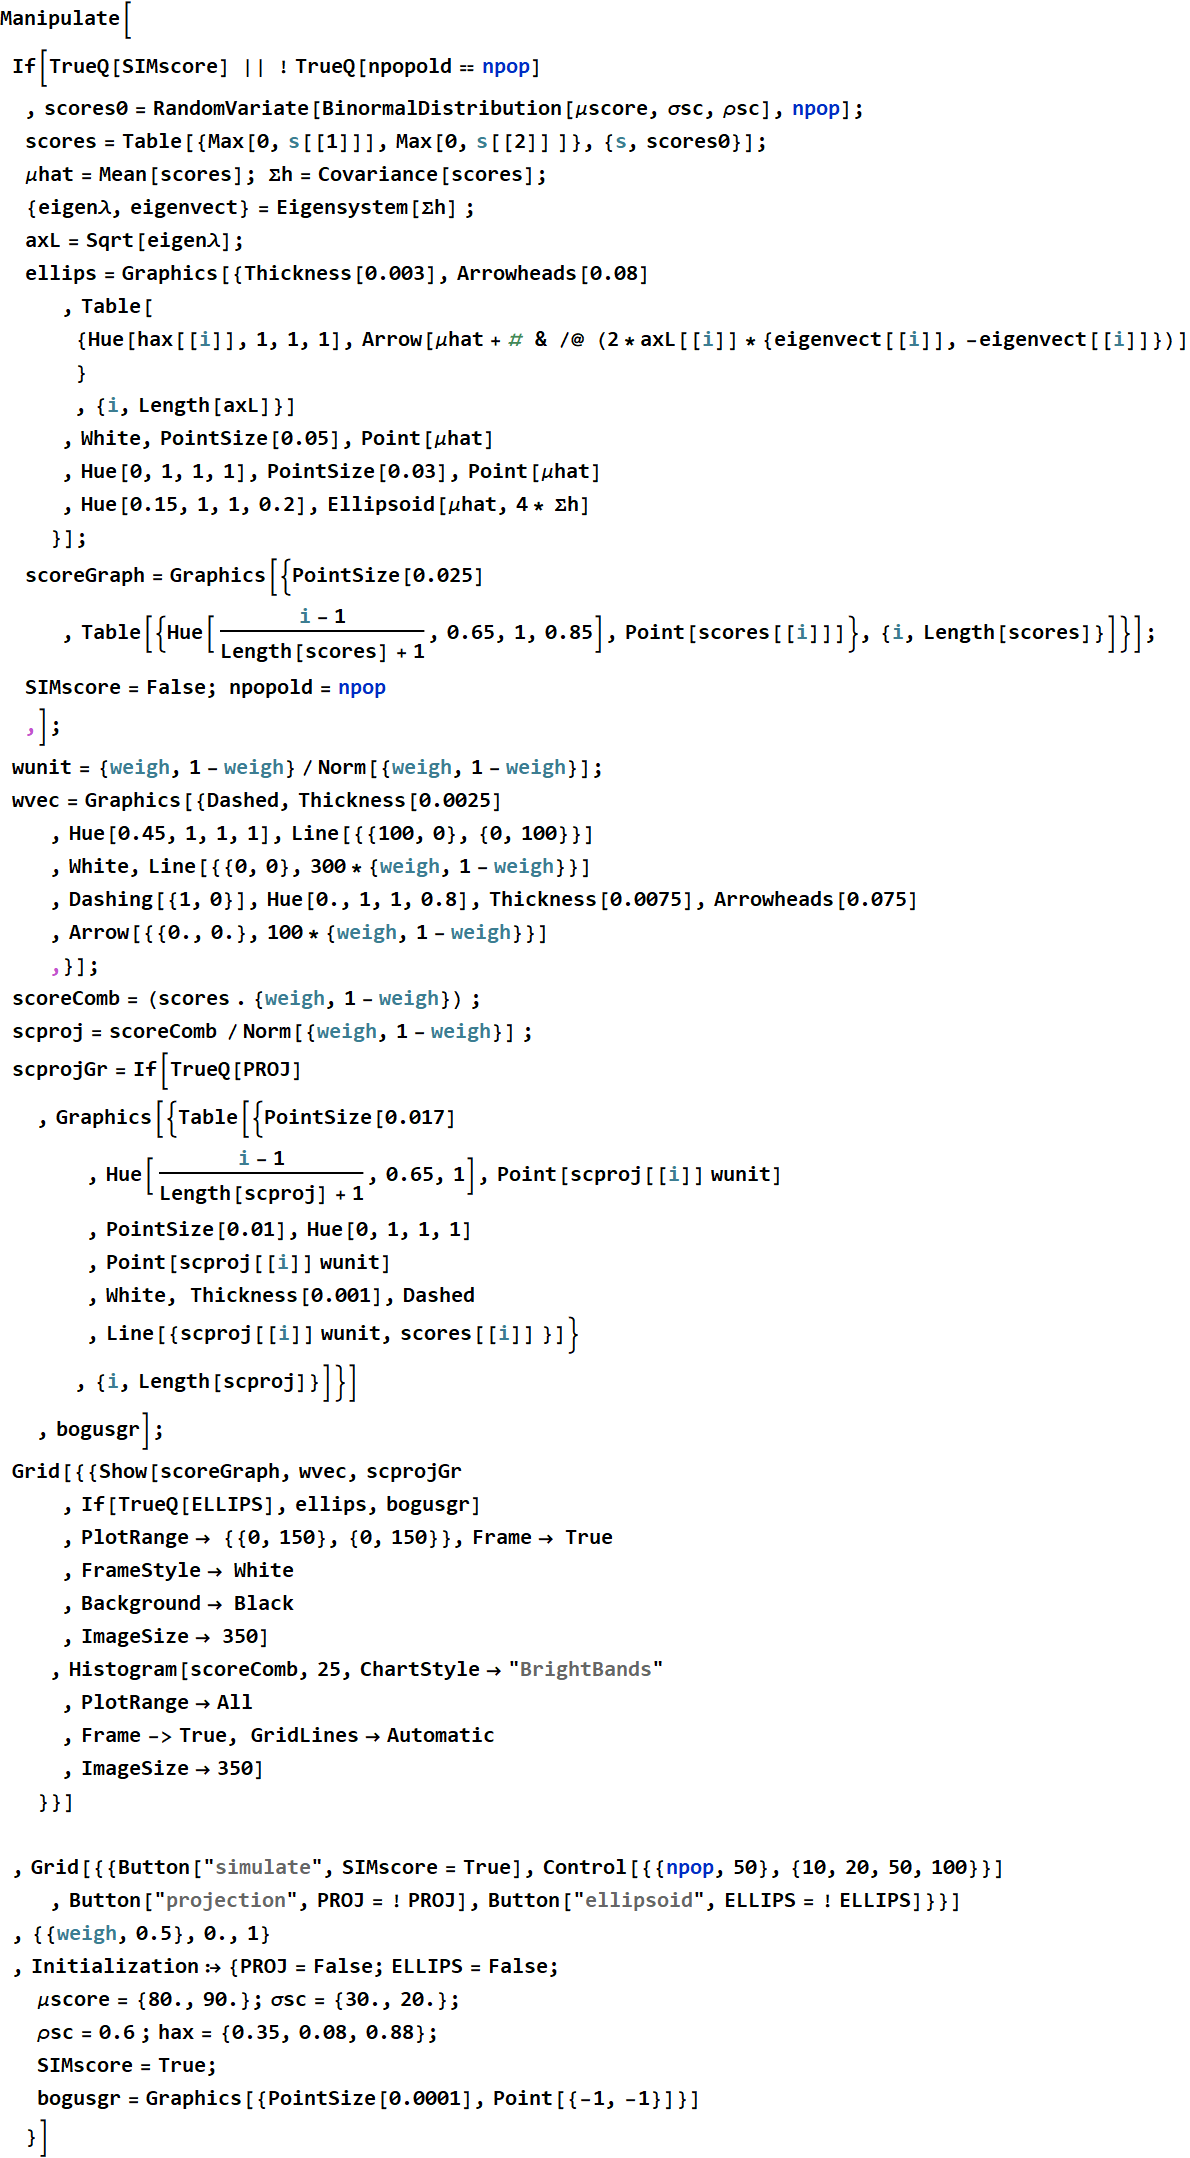
Exercise 1.3
Consider the score of a student as a two-D vector:
{homework, classwork}. One way to combine this into a final score
is to assign a weight to each score, for example:
![]()
Generate a multinormal random distribution to simulate a class (e.
g. 100), and obtain a histogram of the combined score as a
function of weight
Answer (given)
In[141]:=
2. Matrix and vector product
2.1 Table of higher dimension: List of List
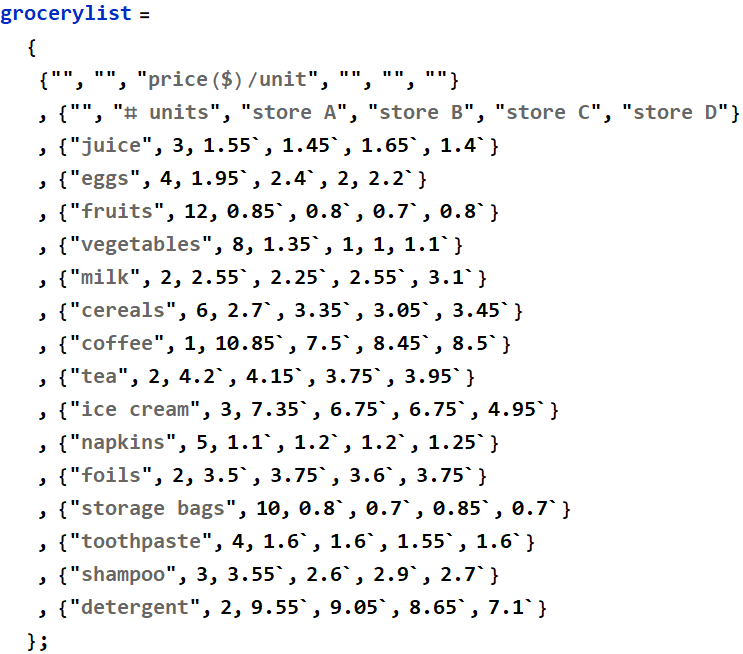
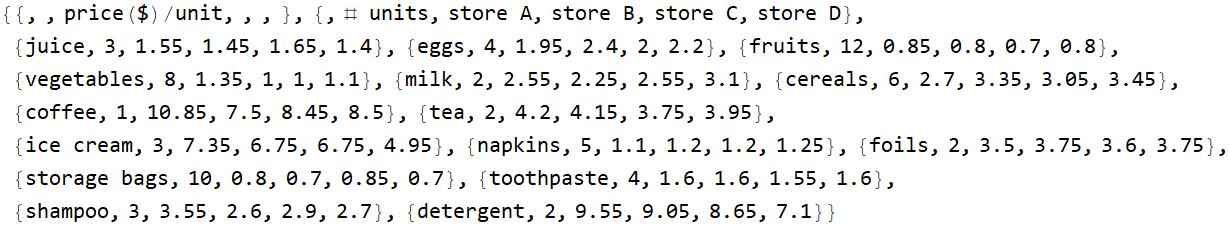
Consider this:
Out[8]=
| price($)/unit | |||||
| # units | store A | store B | store C | store D | |
| juice | 3 | 1.55 | 1.45 | 1.65 | 1.4 |
| eggs | 4 | 1.95 | 2.4 | 2 | 2.2 |
| fruits | 12 | 0.85 | 0.8 | 0.7 | 0.8 |
| vegetables | 8 | 1.35 | 1 | 1 | 1.1 |
| milk | 2 | 2.55 | 2.25 | 2.55 | 3.1 |
| cereals | 6 | 2.7 | 3.35 | 3.05 | 3.45 |
| coffee | 1 | 10.85 | 7.5 | 8.45 | 8.5 |
| tea | 2 | 4.2 | 4.15 | 3.75 | 3.95 |
| ice cream | 3 | 7.35 | 6.75 | 6.75 | 4.95 |
| napkins | 5 | 1.1 | 1.2 | 1.2 | 1.25 |
| foils | 2 | 3.5 | 3.75 | 3.6 | 3.75 |
| storage bags | 10 | 0.8 | 0.7 | 0.85 | 0.7 |
| toothpaste | 4 | 1.6 | 1.6 | 1.55 | 1.6 |
| shampoo | 3 | 3.55 | 2.6 | 2.9 | 2.7 |
| detergent | 2 | 9.55 | 9.05 | 8.65 | 7.1 |
How do we represent such data? It is a table. The first row is just
![]()

In[68]:=
In[69]:=
![]()
Out[69]=
| price($)/unit | |||||
| # units | store A | store B | store C | store D | |
| juice | 3 | 1.55 | 1.45 | 1.65 | 1.4 |
| eggs | 4 | 1.95 | 2.4 | 2 | 2.2 |
| fruits | 12 | 0.85 | 0.8 | 0.7 | 0.8 |
| vegetables | 8 | 1.35 | 1 | 1 | 1.1 |
| milk | 2 | 2.55 | 2.25 | 2.55 | 3.1 |
| cereals | 6 | 2.7 | 3.35 | 3.05 | 3.45 |
| coffee | 1 | 10.85 | 7.5 | 8.45 | 8.5 |
| tea | 2 | 4.2 | 4.15 | 3.75 | 3.95 |
| ice cream | 3 | 7.35 | 6.75 | 6.75 | 4.95 |
| napkins | 5 | 1.1 | 1.2 | 1.2 | 1.25 |
| foils | 2 | 3.5 | 3.75 | 3.6 | 3.75 |
| storage bags | 10 | 0.8 | 0.7 | 0.85 | 0.7 |
| toothpaste | 4 | 1.6 | 1.6 | 1.55 | 1.6 |
| shampoo | 3 | 3.55 | 2.6 | 2.9 | 2.7 |
| detergent | 2 | 9.55 | 9.05 | 8.65 | 7.1 |
Exercise 2.1
Import the data from .csv file given, obtain the price table and name it something.
Answer
In[4]:=
![]()
Out[4]=

In[5]:=
![]()
Out[5]=
In[13]:=
![]()
Out[13]=
| price($)/unit | |||||
| # units | store A | store B | store C | store D | |
| juice | 3 | 1.55 | 1.45 | 1.65 | 1.4 |
| eggs | 4 | 1.95 | 2.4 | 2 | 2.2 |
| fruits | 12 | 0.85 | 0.8 | 0.7 | 0.8 |
| vegetables | 8 | 1.35 | 1 | 1 | 1.1 |
| milk | 2 | 2.55 | 2.25 | 2.55 | 3.1 |
| cereals | 6 | 2.7 | 3.35 | 3.05 | 3.45 |
| coffee | 1 | 10.85 | 7.5 | 8.45 | 8.5 |
| tea | 2 | 4.2 | 4.15 | 3.75 | 3.95 |
| ice cream | 3 | 7.35 | 6.75 | 6.75 | 4.95 |
| napkins | 5 | 1.1 | 1.2 | 1.2 | 1.25 |
| foils | 2 | 3.5 | 3.75 | 3.6 | 3.75 |
| storage bags | 10 | 0.8 | 0.7 | 0.85 | 0.7 |
| toothpaste | 4 | 1.6 | 1.6 | 1.55 | 1.6 |
| shampoo | 3 | 3.55 | 2.6 | 2.9 | 2.7 |
| detergent | 2 | 9.55 | 9.05 | 8.65 | 7.1 |
![]()
In typical
Jupyter notebook, this is what it looks like
2.2 Referencing elements from a multi-D array
2.2.1 Review: from Tutorial 2
Consider this two dimensional array
In[29]:=
Out[30]=
| 0 | 1 | 2 | 3 | 4 | 5 | 6 | 7 |
| 8 | 9 | 10 | 11 | 12 | 13 | 14 | 15 |
| 16 | 17 | 18 | 19 | 20 | 21 | 22 | 23 |
| 24 | 25 | 26 | 27 | 28 | 29 | 30 | 31 |
| 32 | 33 | 34 | 35 | 36 | 37 | 38 | 39 |
In[31]:=
![]()
Out[31]=
![]()
In[67]:=
Out[67]=
2.2.2 Sub-array and slice
Consider this:
Out[13]=
| price($)/unit | |||||
| # units | store A | store B | store C | store D | |
| juice | 3 | 1.55 | 1.45 | 1.65 | 1.4 |
| eggs | 4 | 1.95 | 2.4 | 2 | 2.2 |
| fruits | 12 | 0.85 | 0.8 | 0.7 | 0.8 |
| vegetables | 8 | 1.35 | 1 | 1 | 1.1 |
| milk | 2 | 2.55 | 2.25 | 2.55 | 3.1 |
| cereals | 6 | 2.7 | 3.35 | 3.05 | 3.45 |
| coffee | 1 | 10.85 | 7.5 | 8.45 | 8.5 |
| tea | 2 | 4.2 | 4.15 | 3.75 | 3.95 |
| ice cream | 3 | 7.35 | 6.75 | 6.75 | 4.95 |
| napkins | 5 | 1.1 | 1.2 | 1.2 | 1.25 |
| foils | 2 | 3.5 | 3.75 | 3.6 | 3.75 |
| storage bags | 10 | 0.8 | 0.7 | 0.85 | 0.7 |
| toothpaste | 4 | 1.6 | 1.6 | 1.55 | 1.6 |
| shampoo | 3 | 3.55 | 2.6 | 2.9 | 2.7 |
| detergent | 2 | 9.55 | 9.05 | 8.65 | 7.1 |
What if we want a row or a column of the above? Obviously, we can use Table:
In[64]:=
![]()
Out[64]=
![]()
But there is a way to do that with less typing
![]()
Out[65]=
![]()
Exercise 2.2
Define variable itemname and obtain from the table.
Answer
In[68]:=
![]()
Out[68]=

![]()
Don�t forget to do conversion from string to float.
For an experienced numpy user:
Exercise 2.3
Define variable storename and obtain from the table.
Answer
In[70]:=
![]()
Out[70]=
![]()
2.3 Matrix and vector dot product
Now, should we obtain the price list of each store? It�s OK to do for 4 stores, but what if you are doing market research for 10,000�s of store in the US? We don�t do price list for each store, we do for all stores.
Out[13]=
| price($)/unit | |||||
| # units | store A | store B | store C | store D | |
| juice | 3 | 1.55 | 1.45 | 1.65 | 1.4 |
| eggs | 4 | 1.95 | 2.4 | 2 | 2.2 |
| fruits | 12 | 0.85 | 0.8 | 0.7 | 0.8 |
| vegetables | 8 | 1.35 | 1 | 1 | 1.1 |
| milk | 2 | 2.55 | 2.25 | 2.55 | 3.1 |
| cereals | 6 | 2.7 | 3.35 | 3.05 | 3.45 |
| coffee | 1 | 10.85 | 7.5 | 8.45 | 8.5 |
| tea | 2 | 4.2 | 4.15 | 3.75 | 3.95 |
| ice cream | 3 | 7.35 | 6.75 | 6.75 | 4.95 |
| napkins | 5 | 1.1 | 1.2 | 1.2 | 1.25 |
| foils | 2 | 3.5 | 3.75 | 3.6 | 3.75 |
| storage bags | 10 | 0.8 | 0.7 | 0.85 | 0.7 |
| toothpaste | 4 | 1.6 | 1.6 | 1.55 | 1.6 |
| shampoo | 3 | 3.55 | 2.6 | 2.9 | 2.7 |
| detergent | 2 | 9.55 | 9.05 | 8.65 | 7.1 |
In[14]:=

Out[15]=
| 1.55 | 1.45 | 1.65 | 1.4 |
| 1.95 | 2.4 | 2 | 2.2 |
| 0.85 | 0.8 | 0.7 | 0.8 |
| 1.35 | 1 | 1 | 1.1 |
| 2.55 | 2.25 | 2.55 | 3.1 |
| 2.7 | 3.35 | 3.05 | 3.45 |
| 10.85 | 7.5 | 8.45 | 8.5 |
| 4.2 | 4.15 | 3.75 | 3.95 |
| 7.35 | 6.75 | 6.75 | 4.95 |
| 1.1 | 1.2 | 1.2 | 1.25 |
| 3.5 | 3.75 | 3.6 | 3.75 |
| 0.8 | 0.7 | 0.85 | 0.7 |
| 1.6 | 1.6 | 1.55 | 1.6 |
| 3.55 | 2.6 | 2.9 | 2.7 |
| 9.55 | 9.05 | 8.65 | 7.1 |
storeprice is now a 2D-array, which can also be
called matrix.
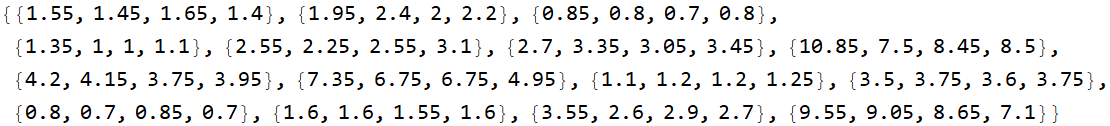
Now, it is too tall, for convenience, we will flip it to the side,
this is called Transpose
In[10]:=

Out[11]=
| 1.55 | 1.95 | 0.85 | 1.35 | 2.55 | 2.7 | 10.85 | 4.2 | 7.35 | 1.1 | 3.5 | 0.8 | 1.6 | 3.55 | 9.55 |
| 1.45 | 2.4 | 0.8 | 1 | 2.25 | 3.35 | 7.5 | 4.15 | 6.75 | 1.2 | 3.75 | 0.7 | 1.6 | 2.6 | 9.05 |
| 1.65 | 2 | 0.7 | 1 | 2.55 | 3.05 | 8.45 | 3.75 | 6.75 | 1.2 | 3.6 | 0.85 | 1.55 | 2.9 | 8.65 |
| 1.4 | 2.2 | 0.8 | 1.1 | 3.1 | 3.45 | 8.5 | 3.95 | 4.95 | 1.25 | 3.75 | 0.7 | 1.6 | 2.7 | 7.1 |
what is the first row of storePrT?
In[75]:=
![]()
Out[75]=
![]()
this is the price of store A. Thus:
In[22]:=
Out[22]=
So, it is easy to calculate the cost for each store:
In[84]:=
![]()
Out[84]=
![]()
Is it the same as matrix vector product? The answer is yes, and we can simply the code by do this:
In[85]:=
![]()
Out[85]=
![]()
For writing, this is what it usually looks like:
In[86]:=
![]()
Out[86]=
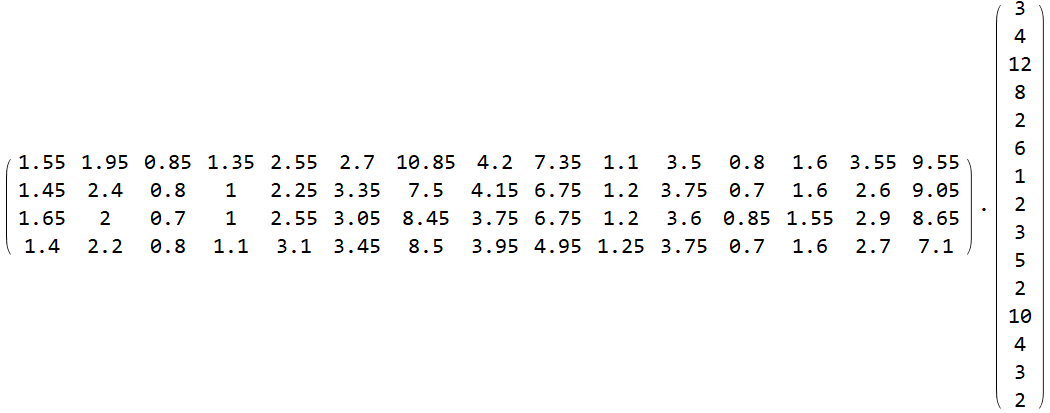
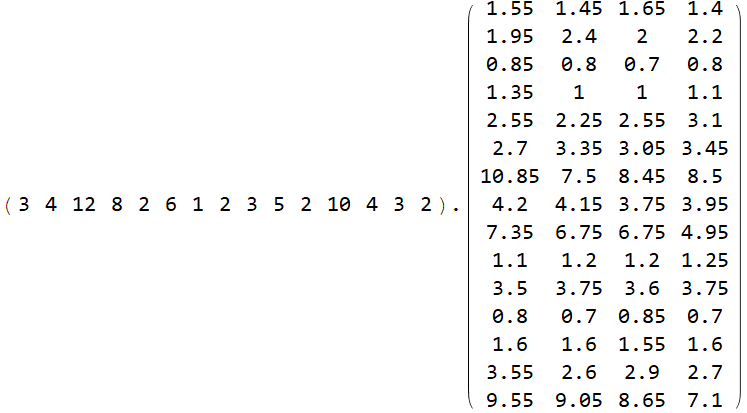
But as we learn in linear algebra, we can also do this:
In[87]:=
![]()
Out[87]=
In[88]:=
![]()
Out[88]=
![]()
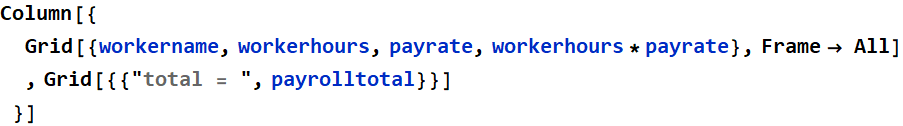
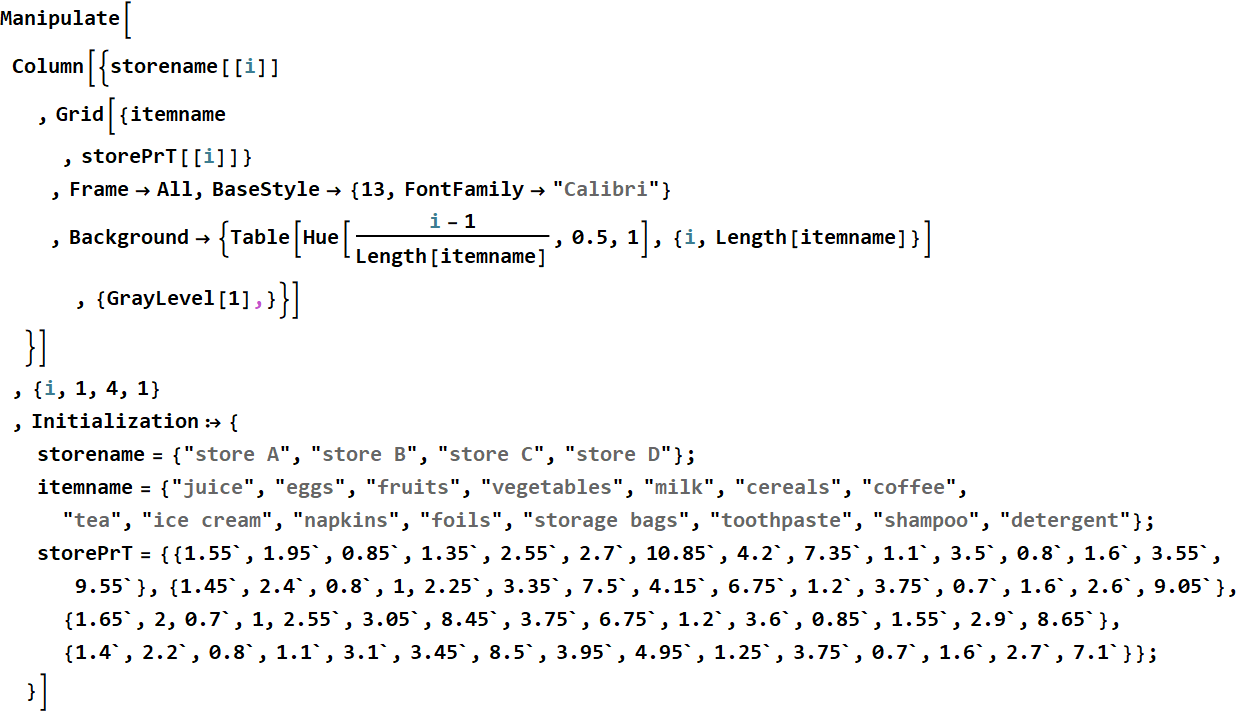
So, the HW 1B problem is quite simple with a few lines:
In[144]:=
Out[145]=
![]()
Out[146]=
Out[147]=
![]()
Out[148]=
![]()
Out[149]=
![]()
Out[150]=
| the lowest cost is | {139.,store D} |
Out[151]=
Out[152]=