Tutorial 3 - Linear Algebra 1
generic ECE - U. Houston
Han Q. Le (c) copyrighted
2.4 Use App to review matrix dot product
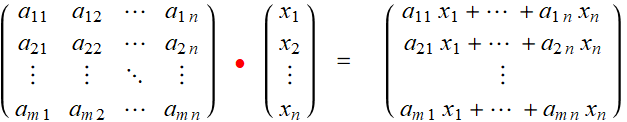
Mathematically, we have two common cases of matrix - vector dot product:
m
× n
matrix n-vector m-vector
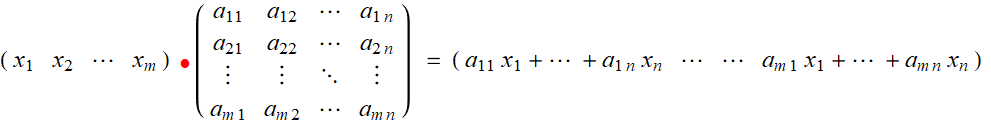
and this:
m-vector m
× n
matrix n-vector
Out[1]
Consider the vector dot product:
Next consider the dot product of a
vector (which is 1D matrix) with a matrix:
We can also have a "row" vector in
front of a matrix:
And finally. we have the general
matrix dot product:
By theorem: ![]()
Hence, we can use transpose whenever convenient.
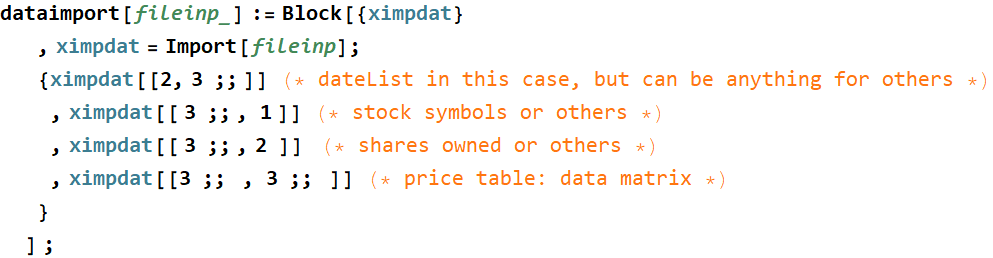
2.5 Apply learning above with portfolio_data.csv
Exercise 2.4
Write a block code to do similar things as the
example with grocery data file for portfolio_data.csv.
Define variables: dateList, stocksymb, shares, pricedata, with
appropriate values.
(follow instructions in class if needed).
In[95]:=
![]()
Out[95]=
![]()
Answer
We can use exactly the same code for the grocery shopping problem to get answer. Except the variable names are changed or generic (just to avoid confusion)
Also, we use DateListPlot instead of barchart.
In[127]:=
Out[133]=
However, if we want to use the same code over and over, we can define a block code.
In[142]:=
Then, we CAN name variables from the generic data according our interest:
In[143]:=

We can find portfolio value at just one time point, say at:
In[145]:=
Out[145]=
![]()
Out[146]=
![]()
End of exercise
We can do some more for fun:
In[147]:=
Out[149]=
Exercise 2.5
Find the portfolio values (name it value) as a function of time (hint: matrix vector product).
Answer
Should we do this?
In[29]:=
![]()
Out[29]=

The answer is no. There is a much more elegant, mathematically correct, and code-wise efficient way to do, it is matrix vector product:
![]()
Out[103]=

Exercise 2.6
Use DateListPlot to plot portfolio value vs time. You need to pair date (time) with its corresponding portfolio value.
Answer
In[104]:=

Out[104]=
Below shows some styling approach:
In[134]:=
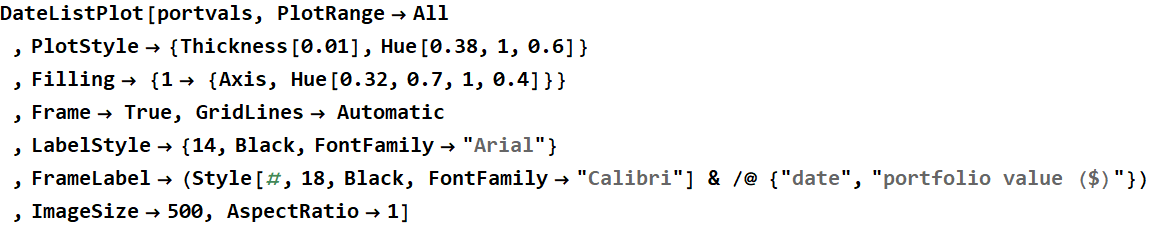
Out[134]=

Mathematically, this is what it looks like:
In[135]:=
This is known as matrix “dot” vector product. In this case, the vector is a column. Each element of a row of the matrix is multiplied with the same index element of the column, and all are summed together to give an element of the output, which is the value of the portfolio.
For display convenience, we have transposed the
price matrix so that each row corresponds to a time point, and the
column are the prices of the stocks in green above.
Back to: page 1 Next to: page 3