Link pages
|
ECE 2100 About
Digilent AD 2 -
Miscellaneous
|
Important: see Digilent phase error below.
Notes:
https://reference.digilentinc.com/reference/software/waveforms/waveforms-3/start
More general about AD 2 including hardware:
https://reference.digilentinc.com/reference/instrumentation/analog-discovery-2/start
As an example, consider about what its Scope function can do:
https://reference.digilentinc.com/reference/instrumentation/guides/waveforms-oscilloscope
In Lab 4, for example, we discuss about using the cursors for measurement. The exercise is important for the reason that our brain-eye-hand coordination can develop a learned knowledge about signal magnitude estimates. It is like learning how much steering one can do when seeing the road bends ahead. An experienced driver needs no one to give instruction such as "turn the steering wheel to the right at the rate of such and such radian per minute for certain duration and let the steering wheel trace back after the car makes a full turn..."
But of course, with AI-assisted driving, we can let the car make the turn itself, and not bother with learning how to steer a car by ourselves. An analogy is to use the scope with built-in measurement functions as shown below, and instead of using the cursors, you can just click to add the measurement functions such as peak-to-peak, frequency, phase, etc. as shown in the Digilent instruction below:

Nothing wrong with automation and please go to this page as an example of running "batch processing". Scroll down to the bottom. The page shows that a bunch of data files are collected and saved, then an app can run to complete the whole data analysis and plot the final results, the Bode plots for amplitude and phase.
Digilent phase error
If you use Digilent phase measurement, there are two things you should be aware
i- The built-in code in the software has potential error
ii- The sign of the phase is ambiguous, because its algorithm does not use quadrature.
If you are in a bind, it is OK to use the given app to obtain Bode plot and Nyquist plot. Do not use Digilent function that can be erroneous. However, do not use the app blindly without understanding how to check for validity. See details below.
The problems are explained in details below:
The code that Digilent AD2 uses to calculate the relative phase of two sinusoidal signals has a problem: it does not remove the DC level of the signal. The error is illustrated in the video below. As the signal from channel 2 is DC-shifted with an offset, the phase measurement becomes erroneous. Do not use this function for the phase measurement of two signals without correction.
Phase calculation can easily be done by using this formula:

Both signals should be sampled over many periods. In practice, there might usually be a DC level associated with a signal either by design or inadvertently. Normally, any algorithm will remove the DC level of each signal before using the formula. Digilent AD 2 code is:

It does not remove the DC level of each signal, resulting in the errors in the video. It is recommended to define a modified phase function, such as phaseCorr (for corrected phase) with the code below:
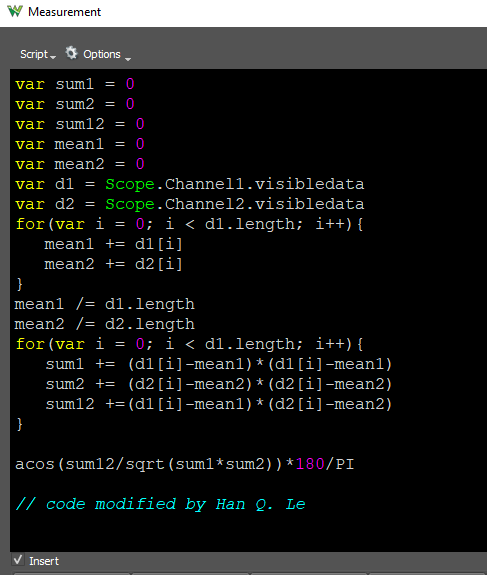
Below is an illustration of the result with this code:
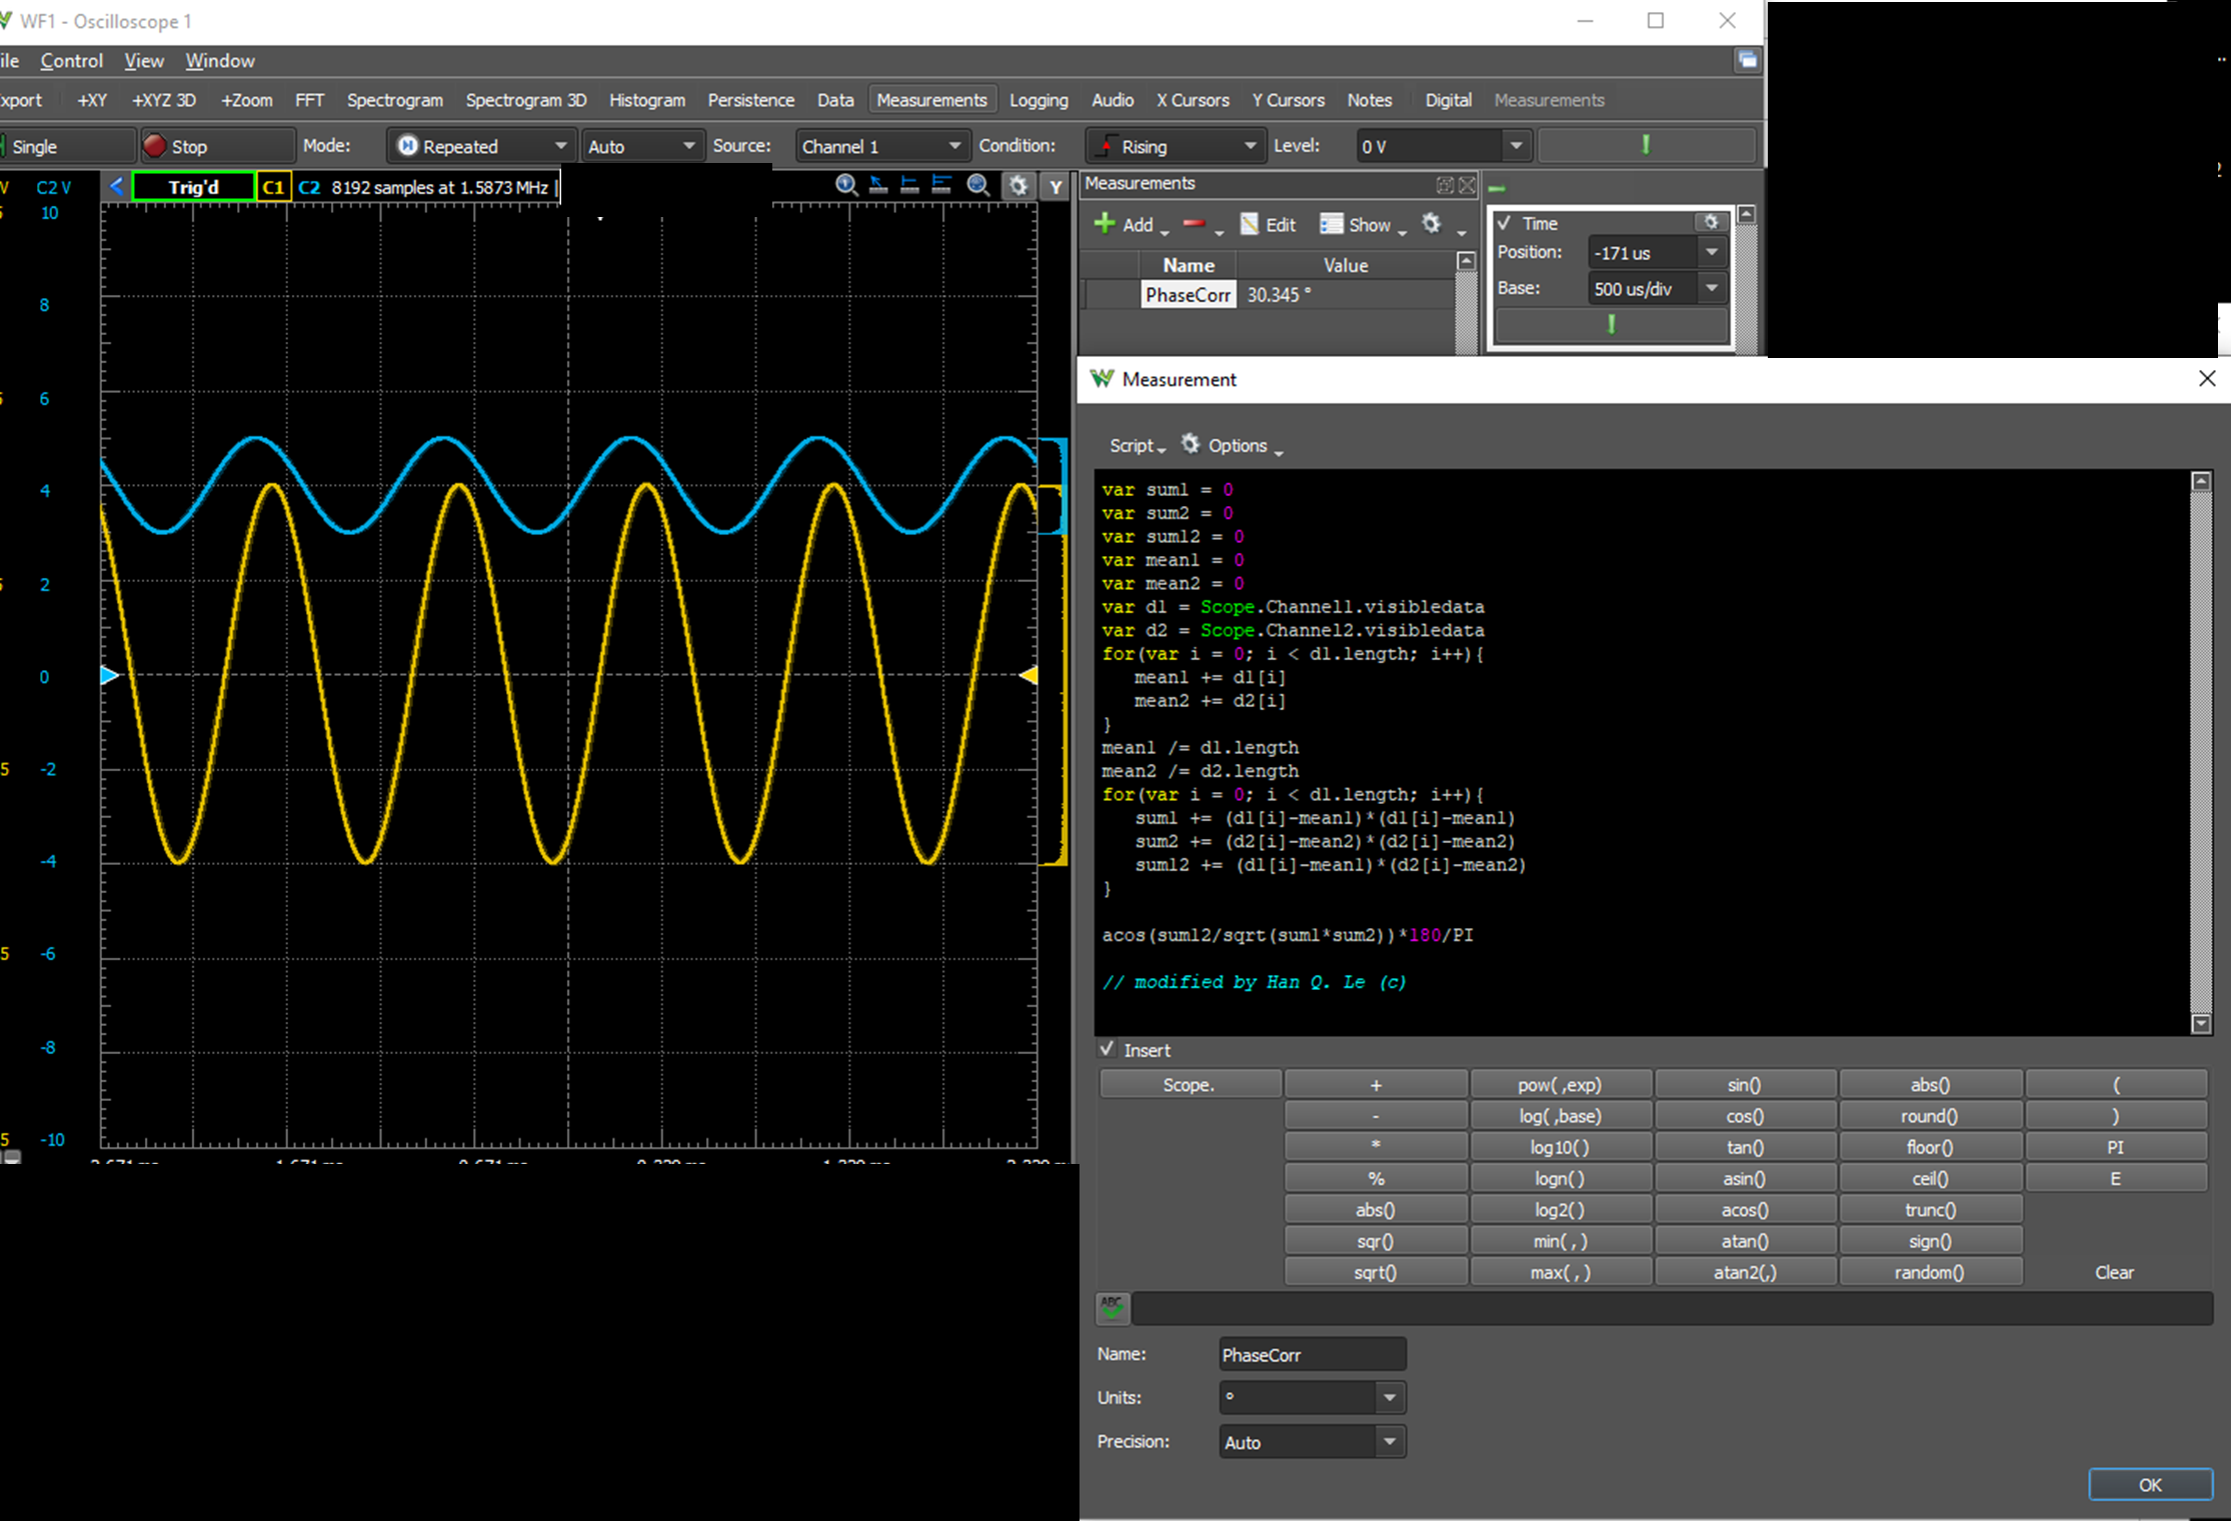
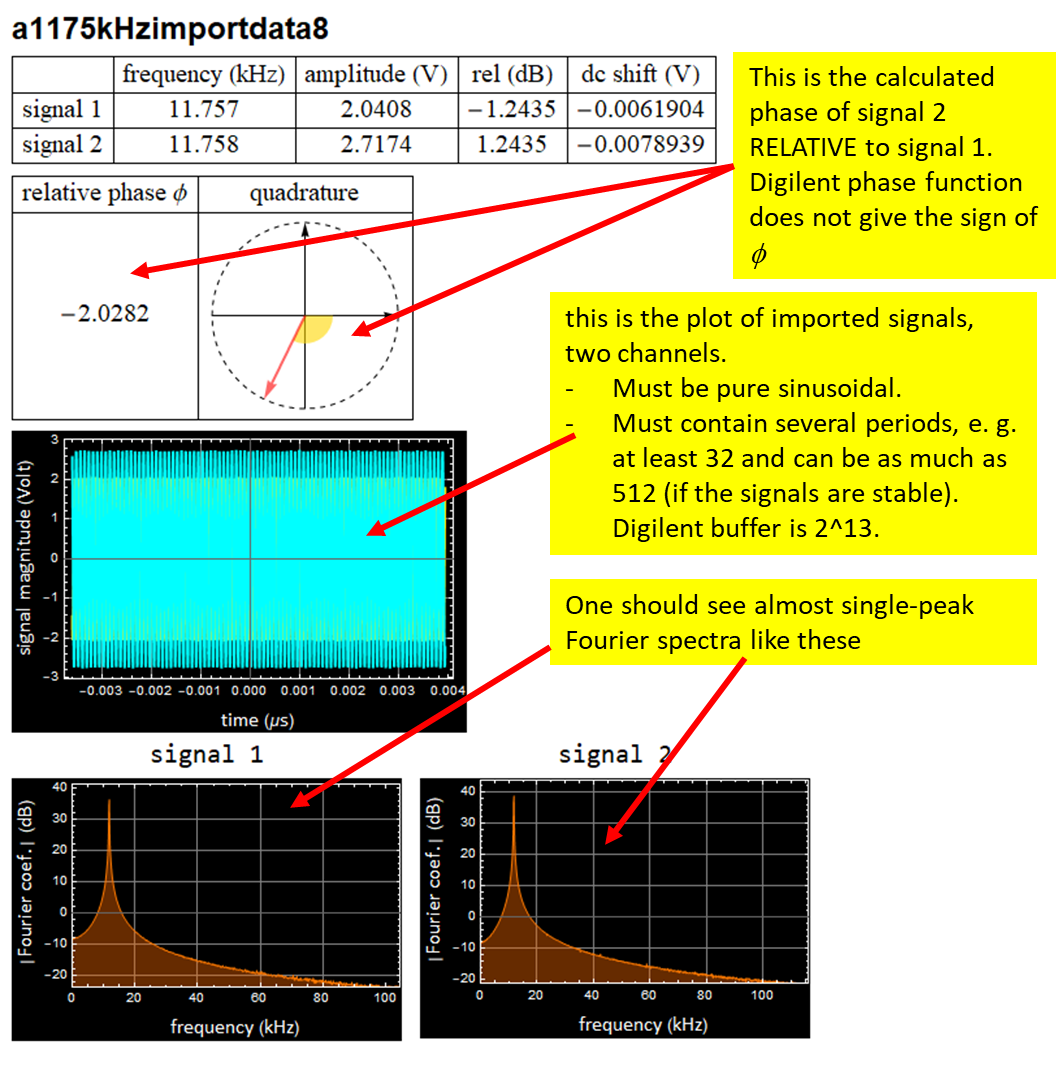
However, the code above is still insufficient, it gives only the absolute magnitude of the phase, not the sign of the phase that is needed for Bode and Nyquist plot. Contact me for the js script code that calculates the true phase (longer than the code above).
Understand the Mathematica app:
Please see below. Here are things to remember:
i- The signal must be as purely single harmonic as possible: look at the Fourier spectra of the signals. If you see many peaks with power not much smaller than the fundamental, it means your signal is not purely sinusoidal. Preferably, all other harmonics should be lower than -20 dB from the fundamental (strongest) peak; the lower, the better.
ii- The two frequencies must be the same within the measurement uncertainty, which depends on your setting of the scope prior to the import of the data.
iii- DC level shift. Although the algorithm will remove the DC level shift, if you use an op amp, a high DC level shift nears the op amp +vs and -vs, it may indicate a problem.
The phase output is in radian, and is mapped to - Pi to +Pi, Add 2 Pi, then modulo 2 Pi. In Mathematica, modulo function is Mod, ex: Mod[var,2 Pi]