

|
|
ECE 2100 Lab. IV -
Dependent Sources -
Operational Amplifier
Voltage Amplifier, Transimpedance Amplifier Please
download these
items:
1. Lab 4 workbook and report 2. ECE_2100_Lab_4_guide_Part_0 ECE_2100_Lab_4_guide_Part_1 Special guide: ECE_2100_Lab_4_CircB_wiring_guide Special guide: ECE_2100_Lab_4_Part_1_Step_5_AD2_guide ECE_2100_Lab_4_guide_Part_A ECE_2100_Lab_4_guide_Part_B and C see demonstration and write a report only) |
Update page a
|
Lab work modification: - Do Part 0 ( Introduction), Part 1 (Instrumentation), and Part A only (three parts total): do everything, including answering/discussion all questions.- Experimental work of Part B and C are not required: It means no circuit, no measurement needs be done. You are required to only observe and write a report of your understanding, thoughts, and summary of these Parts. This should be put at the end of your report, a synthesis of everything that you learn in Lab 4. Create a subsection, titled "Report on observation of Parts B and C demonstrations". Do not mix this with what you summarize for your work in Part A. However, if you do anywork along the line of Part B and Part C, you are welcome to include for extra credit. |
Important: Digilent AD2 - a note
General note: Warning:
Erroneous phase calculation of
Digilent AD2 WaveForms software
Do not
use the phase function in
"Measurement" function of Digilent
AD2 Scope function without reading
this and do correction.
The code that Digilent AD2 uses to calculate the relative phase of two sinusoidal signals has a problem: it does not remove the DC level of the signal. The error is illustrated in the video below. As the signal from channel 2 is DC-shifted with an offset, the phase measurement becomes erroneous. Do not use this function for the phase measurement of two signals. See below for different approaches.

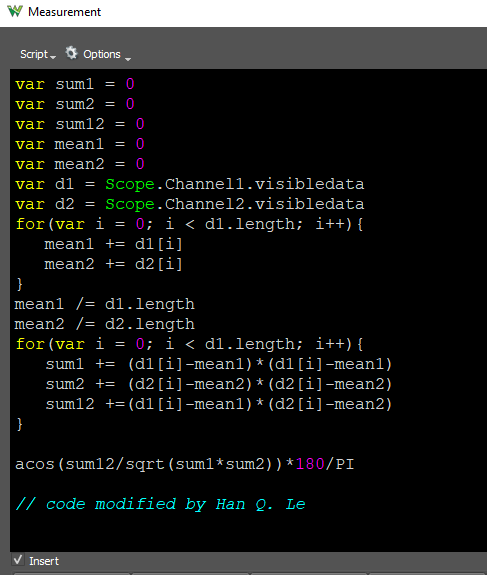
Both signals should be sampled over many periods. In practice, there might usually be a DC level associated with a signal either by design or inadvertently. Normally, any algorithm will remove the DC level of each signal before using the formula. Digilent AD 2 code is:

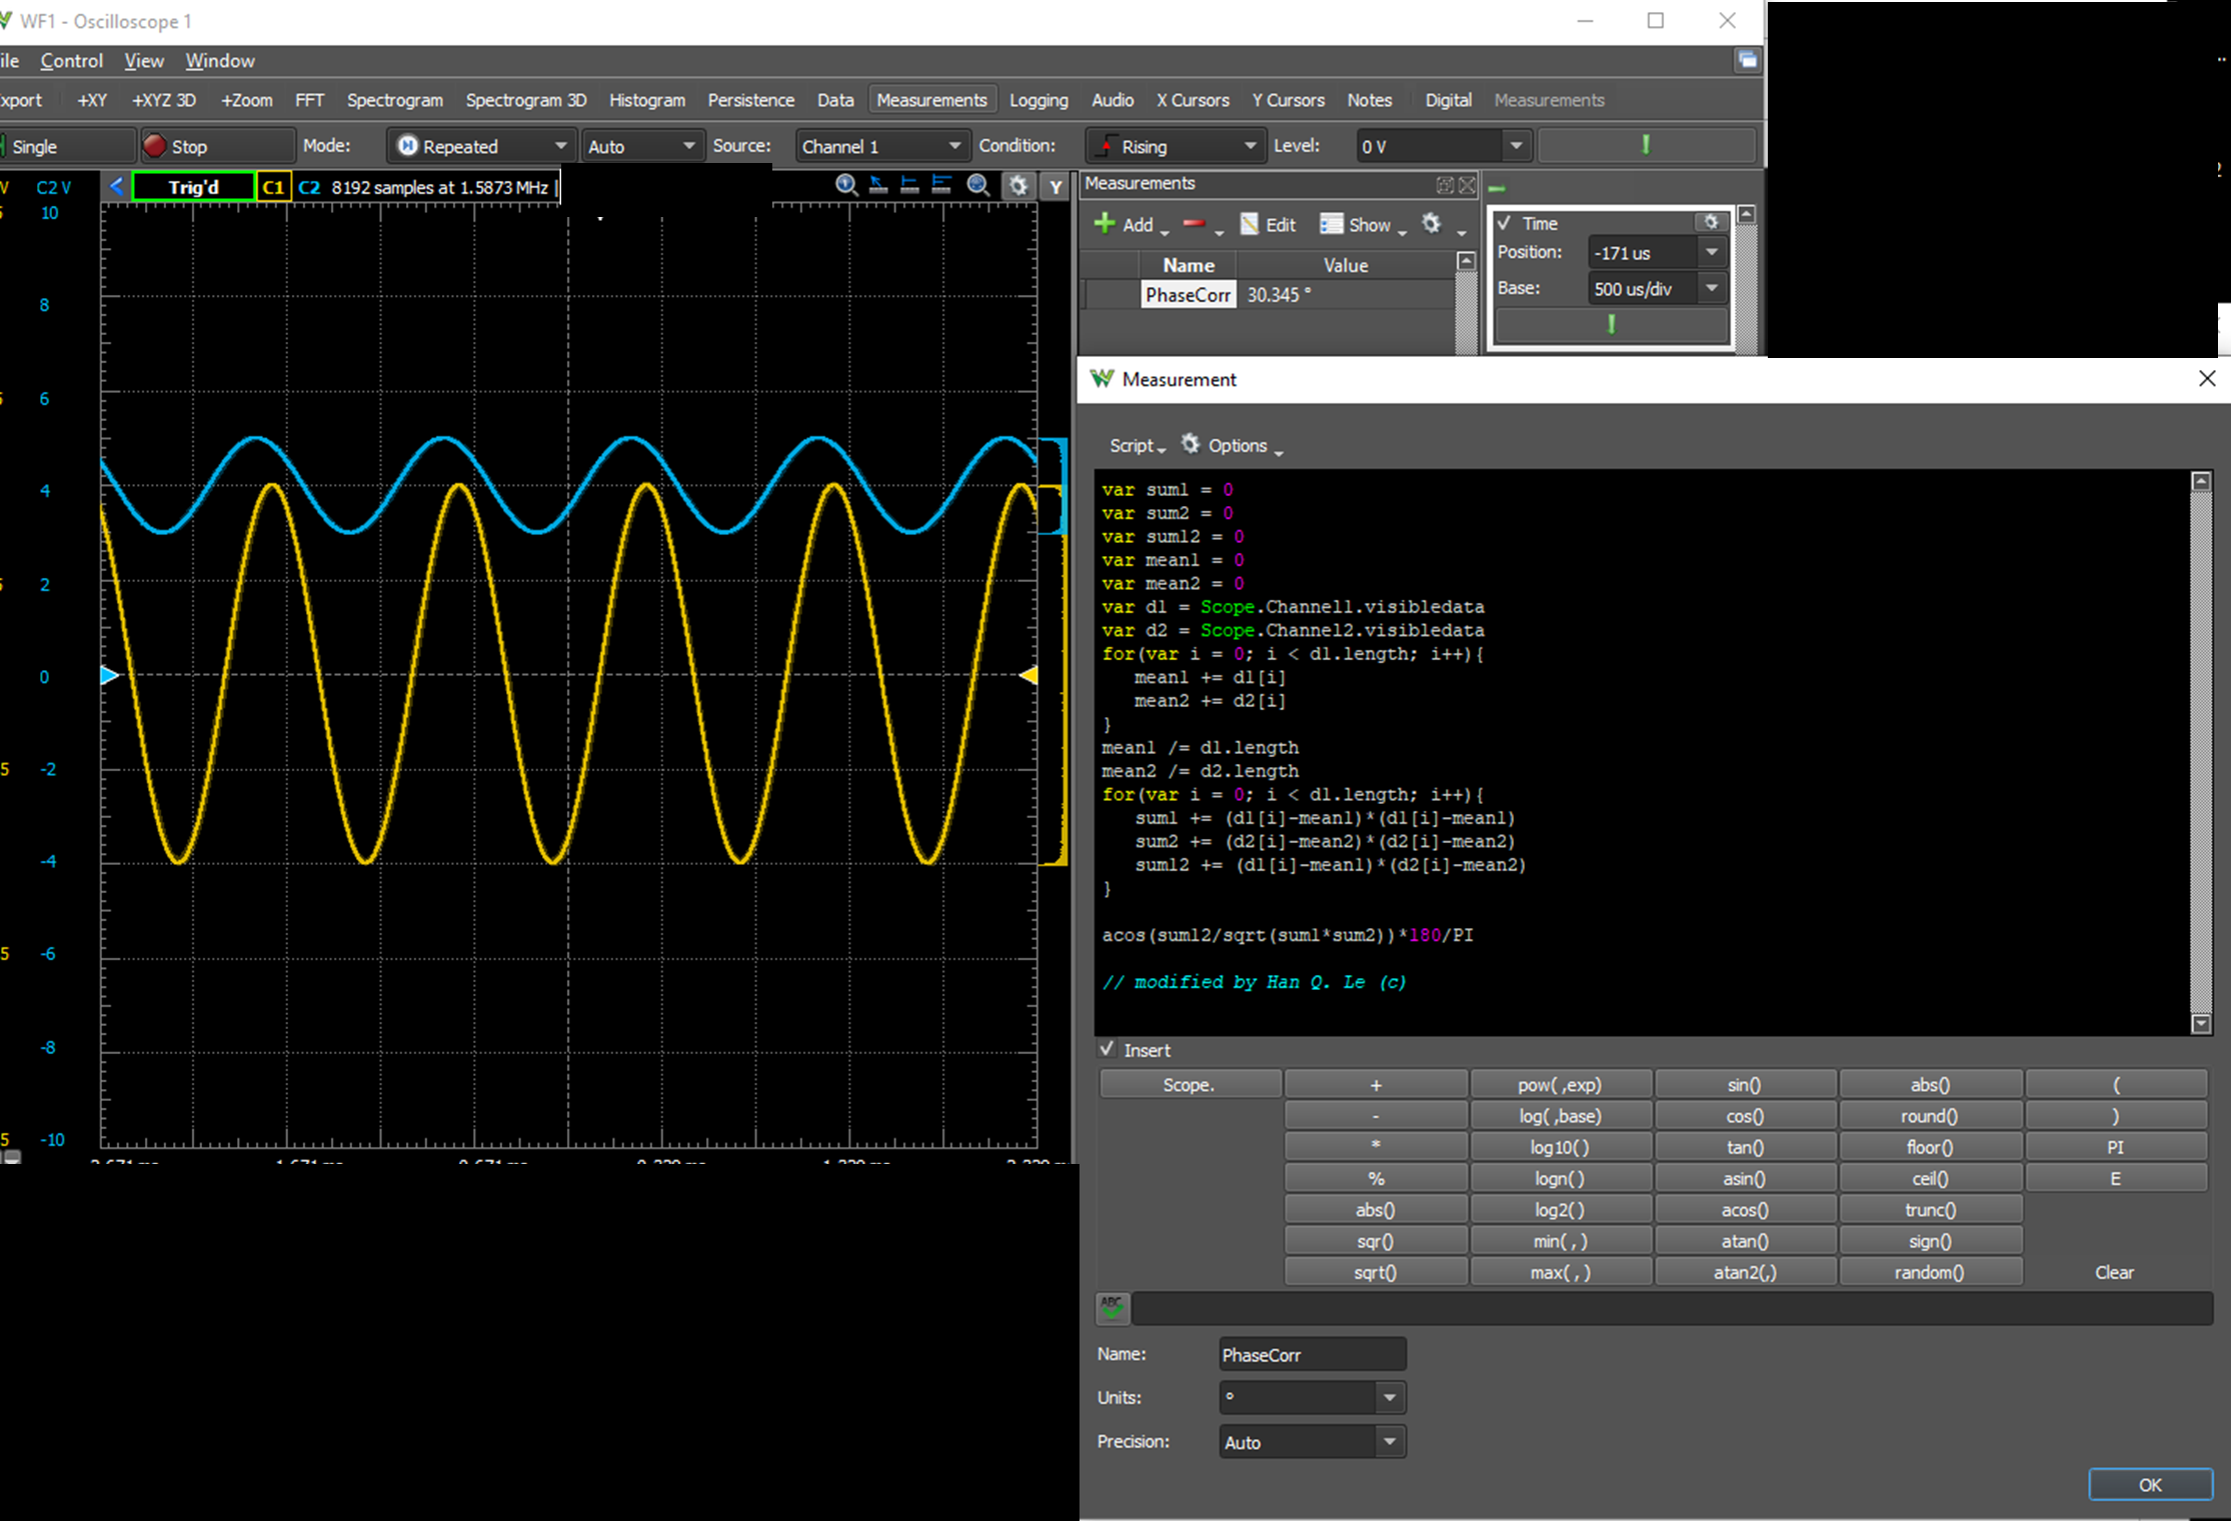
It does not remove the DC level of each signal, resulting in the errors in the video. It is recommended to define a modified phase function, such as phaseCorr (for corrected phase) with the code below:
Below is an illustration of the result with this code:
Using the mean to subtract the DC level is a good approximation but not as accurate as some other algorithm; and it also lacks quadrature calculation for a definitive phase sign, which requires a bit more calculation. For full data analysis including Bode plots and Nyquist graphs on saved .csv files from Digilent AD 2 Scope function, use this app:
Example of the app output:
Below shows how to export the data, and calculate the phase with a correct, full, and more accurate algorithm.
This video shows the scope data are saved as .csv file, so that calculation can be done later.
This is the correct calculation results, in a pdf file:
So, what should one do?
1. Modify the code as shown above, make sure including many periods like 16, 32 in the scope trace using a long time base; or
2. For the time being, for Lab 4, just use the app in Part A, Step 5. It looks like this for each data file,

Or use the full app:
The video above uses the same app, but with the option of calculating all the files in a folder, and perform Bode plots of amplitude and phase of a circuit response. Just do calculation one by one and the result is the same. If we use input signal as sinusoidal without any DC level, the output DC should be close to zero (but not always as we will see in Lab 5), and the error will be small.
Part A - Miscellaneous
notes:
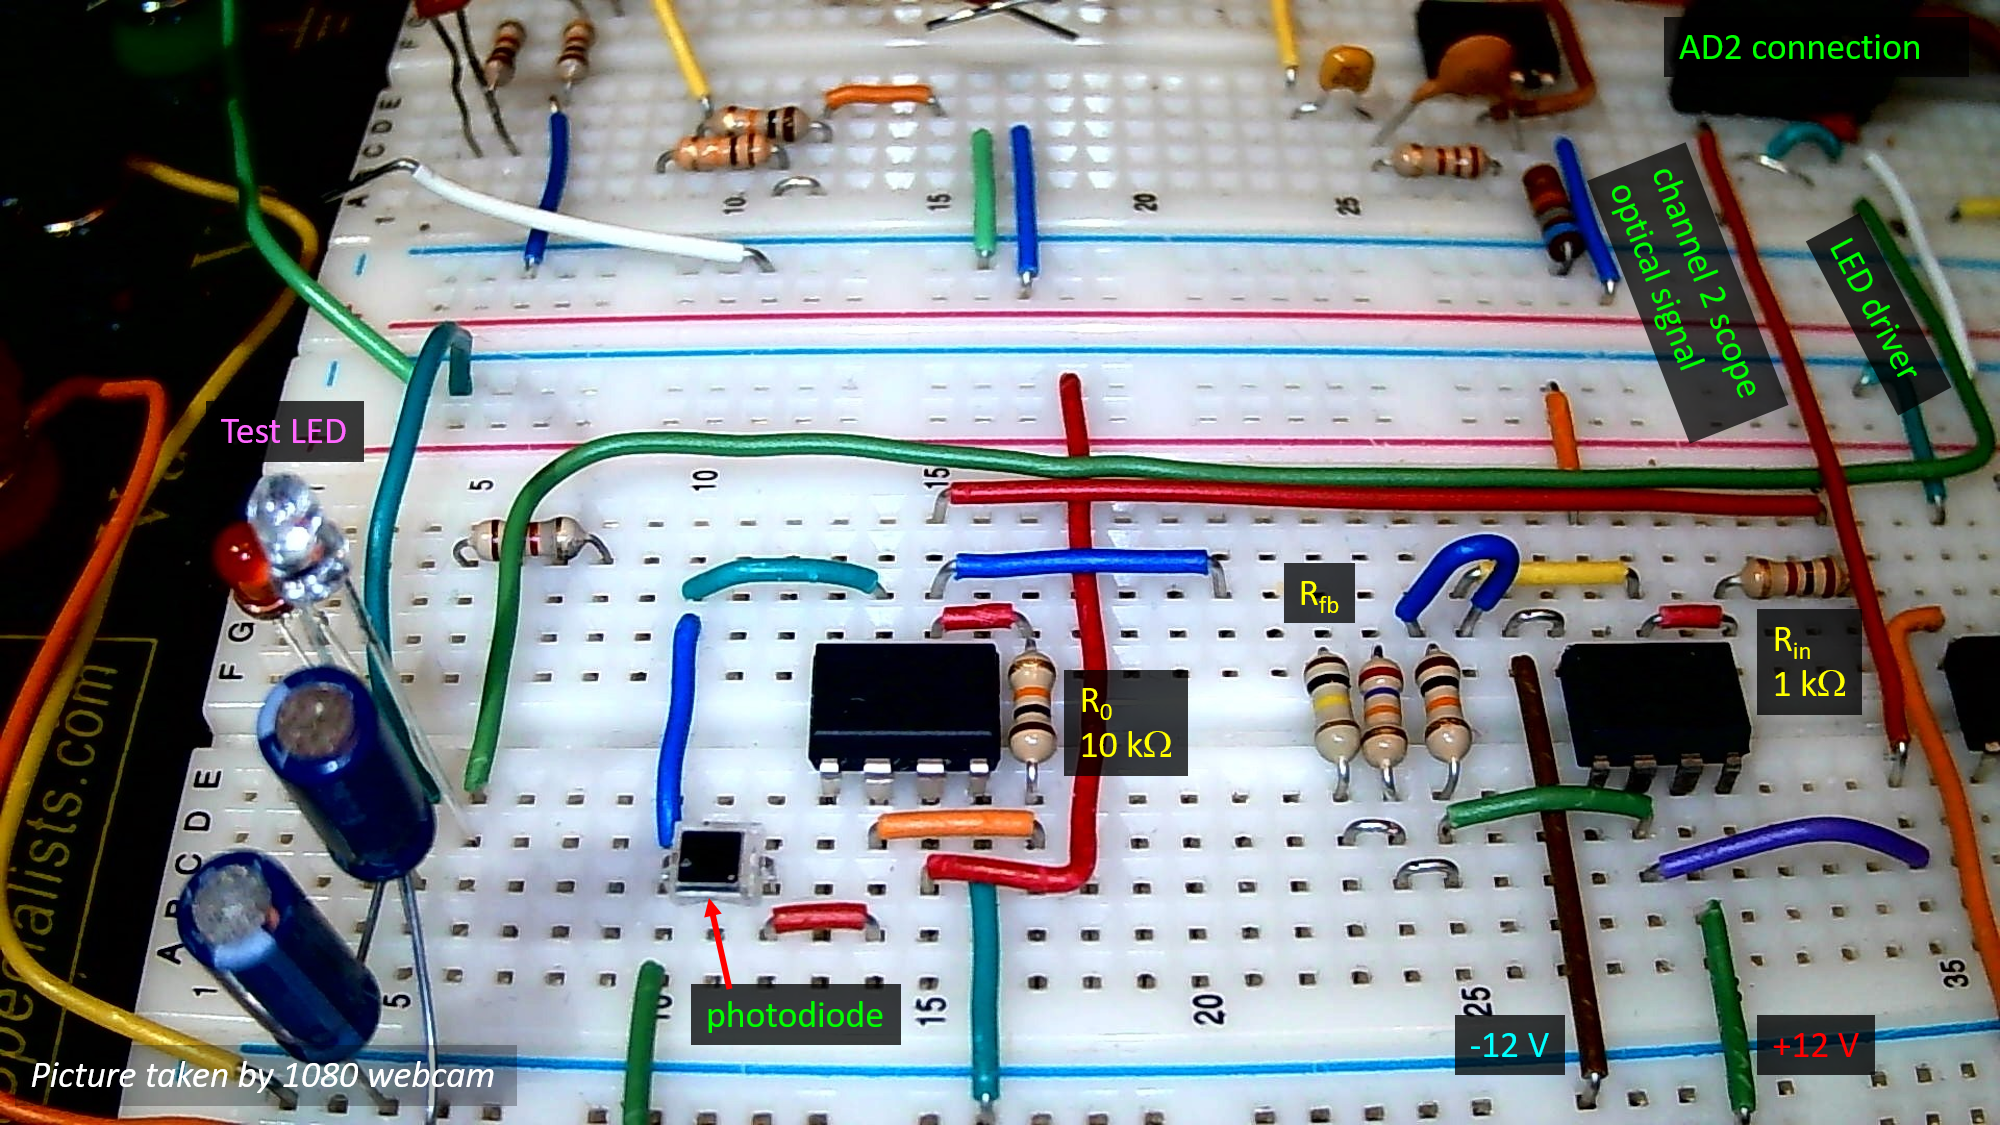
Complete circuit of Lab 4
Below is the
complete circuit with the photodiode and
the transimpedance amplifier.
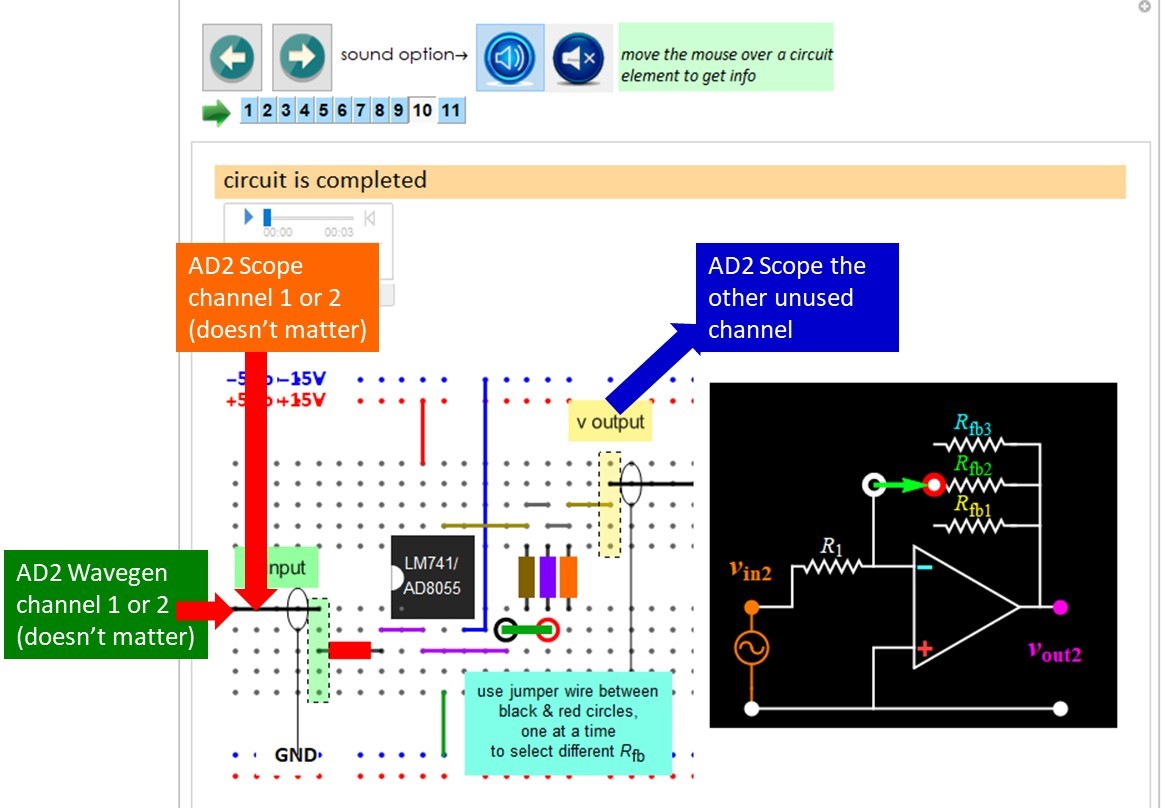
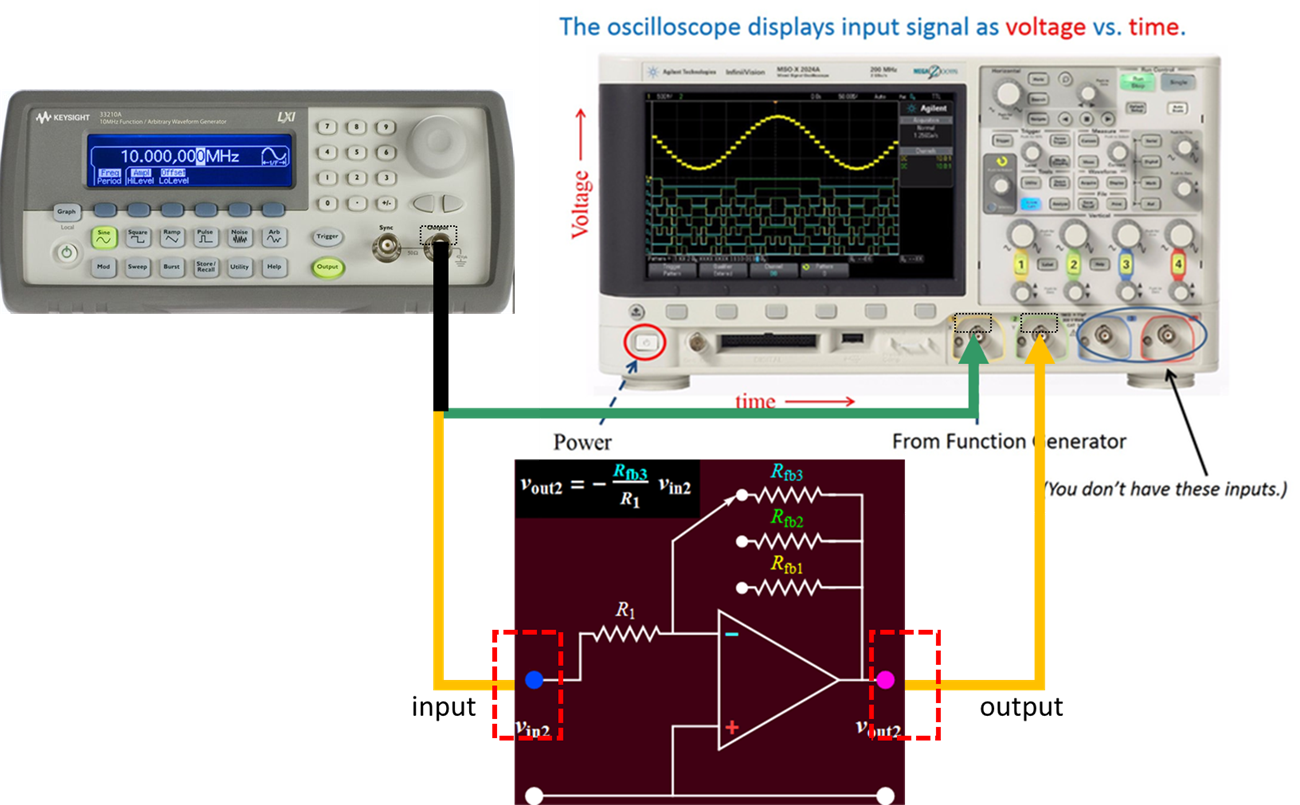
Voltage amplifier circuit:
wiring
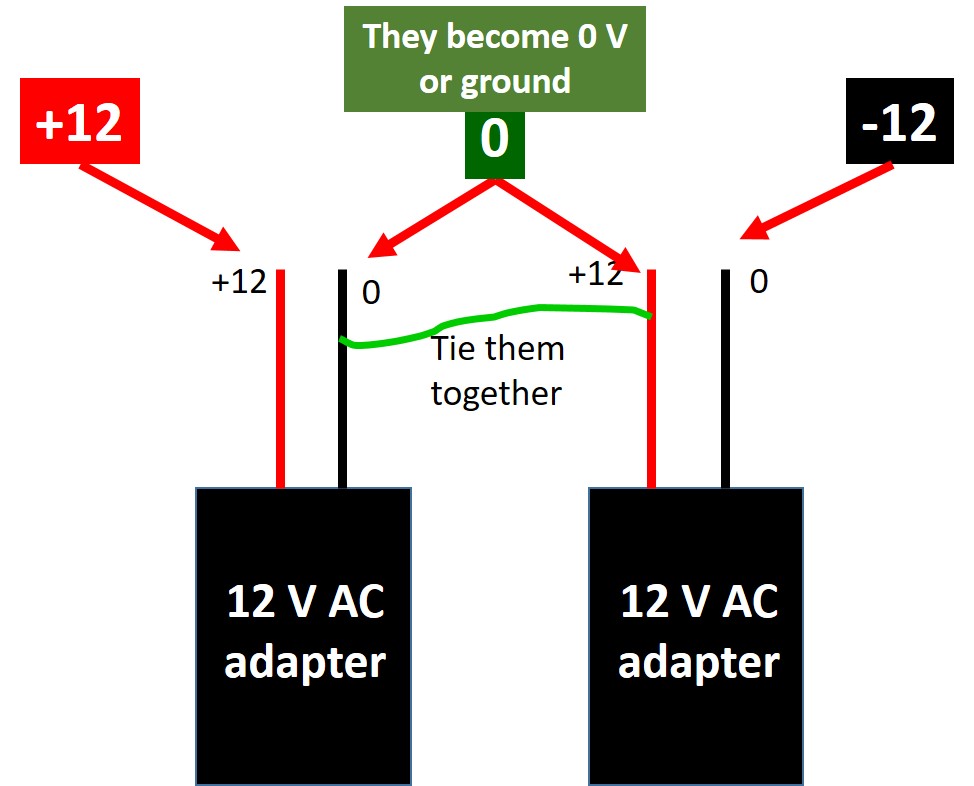
Connecting the 12-V AC adapters:
Voltage amplifier circuit: connection
For Digilent AD2
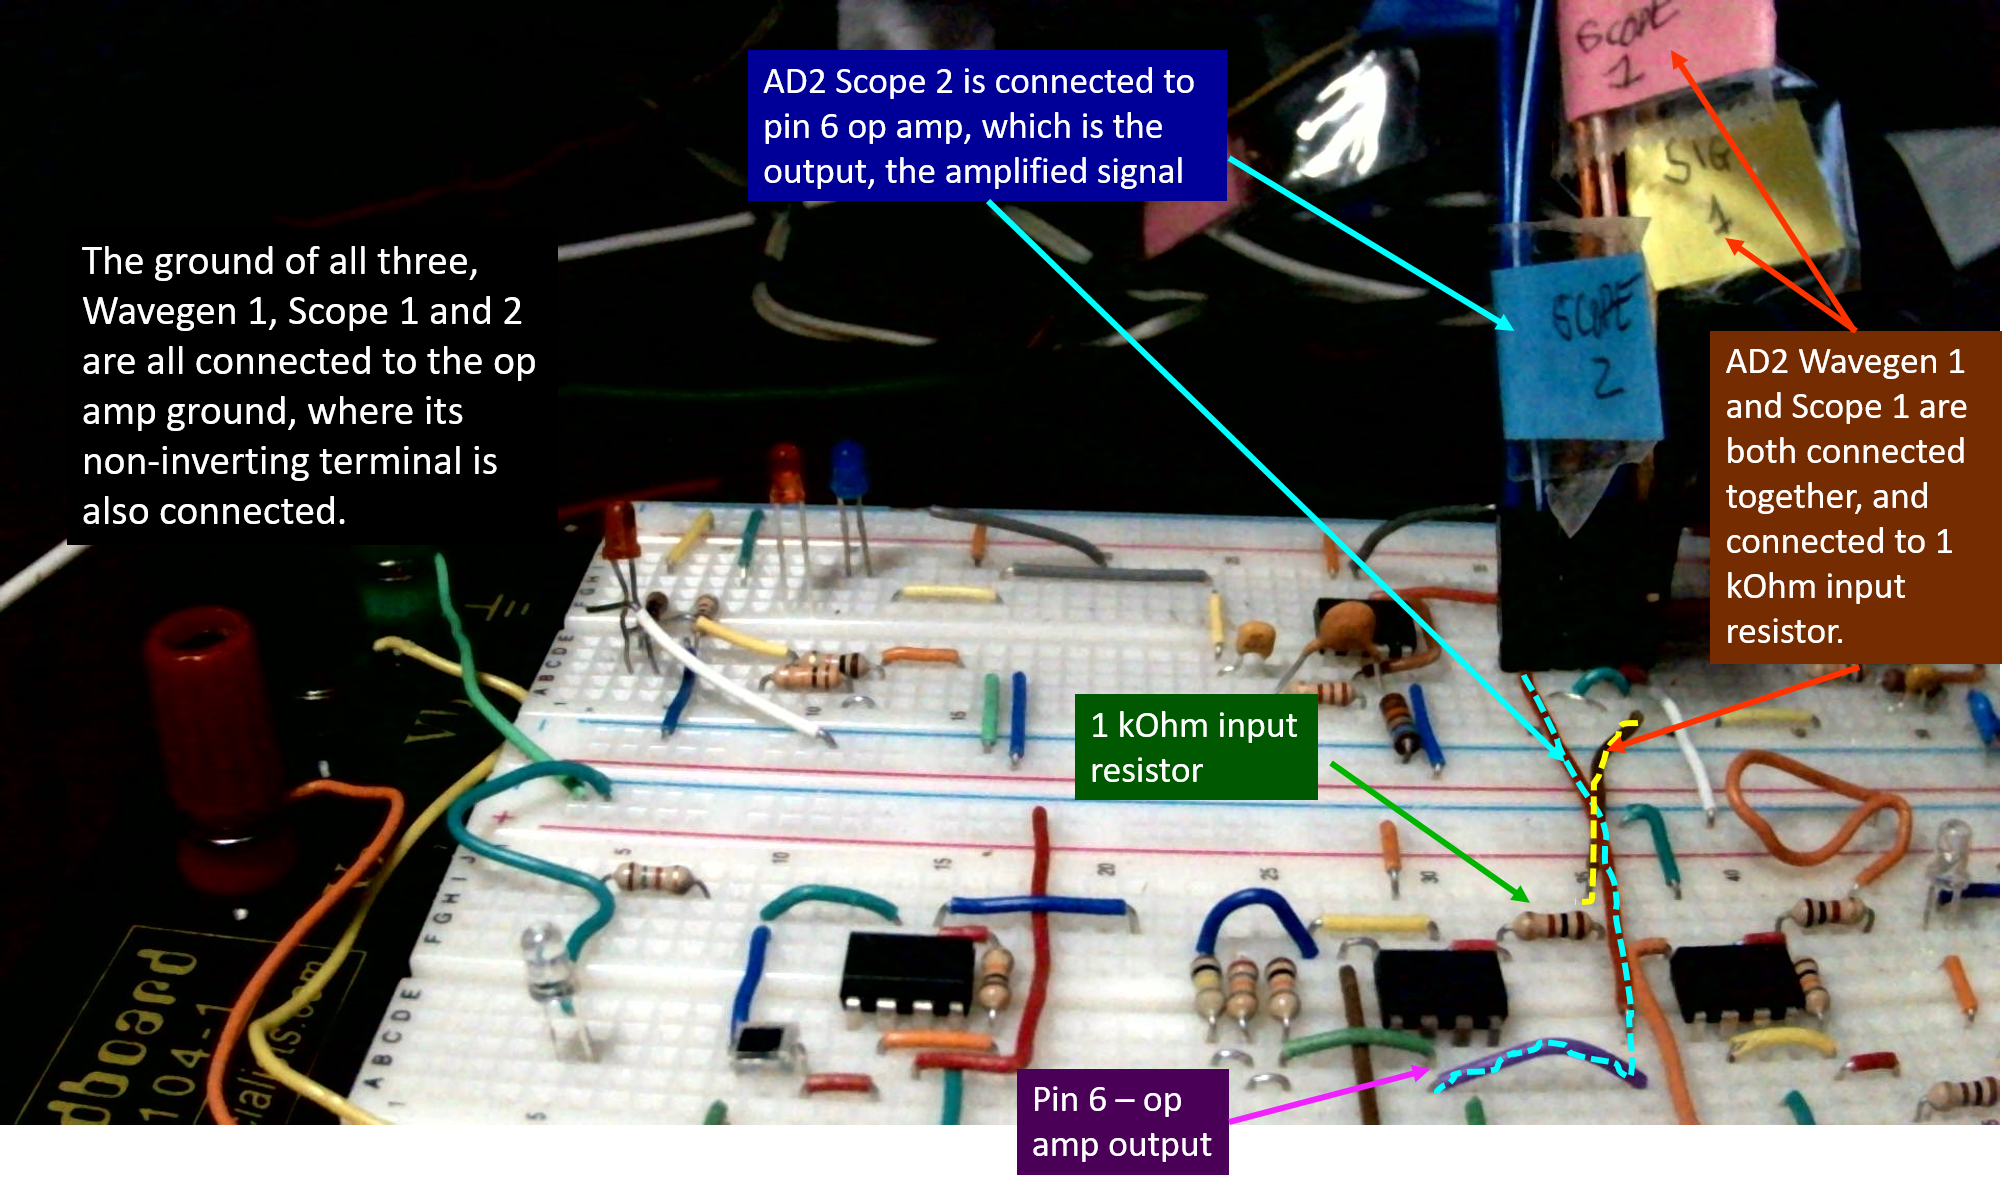
How to connect the AD 2 to the circuit
Since we don't have coaxial cable, just connect a Wavegen channel (yellow or white) to the input, and its ground (black wire) to the circuit ground, which is the ground of the two AC adapters connected together as shown above. The picture below shows the outer conductor (the ellipse) of the coaxial cable input connected to ground, but not its center conductor, which is to be connected to the input.
For instruments in the Undergraduate Lab
Part A: An example of basic signal measurement with a potential pitfall
One can use the Scope Measurement function of the Digilent AD 2 to perform basic signal amplitude, frequency, phase measurements. However, it is worthwhile to be aware of some potential error as shown in the video below.
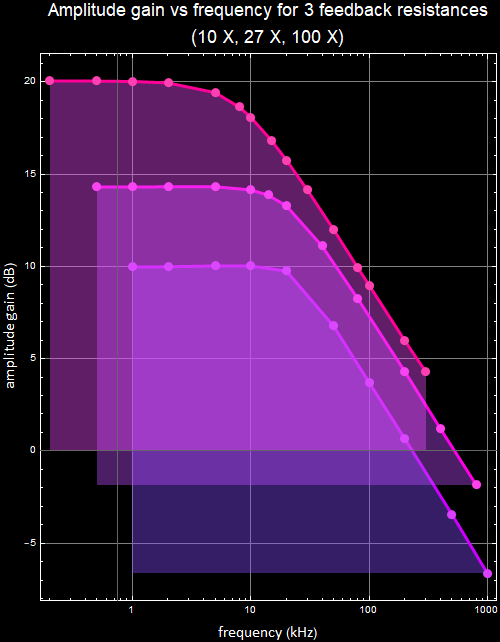
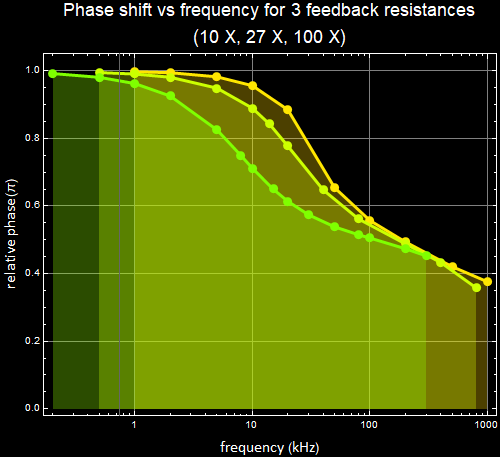
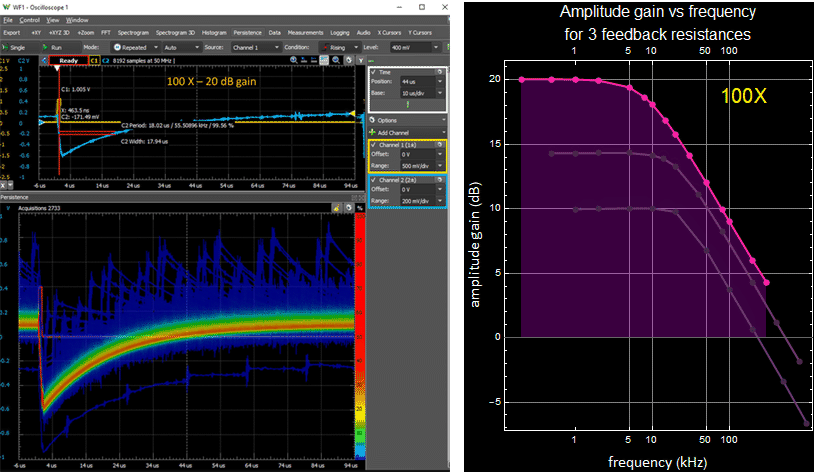
Part A: Example of bandwidth measurements
Examples of bandwidth measurements with Bode plots
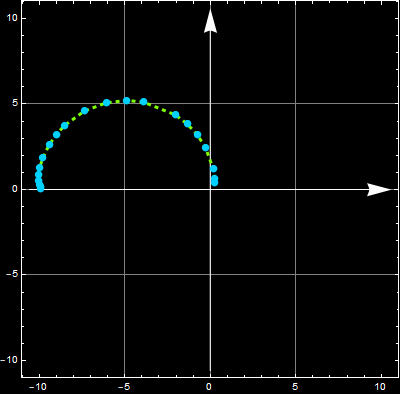
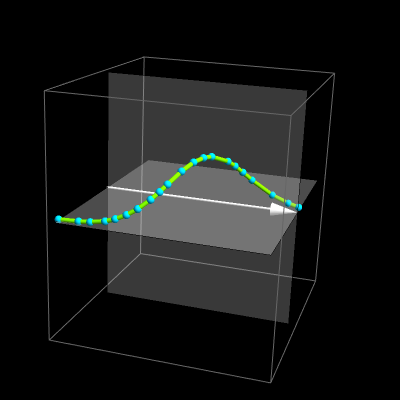
Below are examples of Nyquist 2D and 3D graphs for the 10 x gain result:
Below are two videos showing what to do for one of the steps of Part A. The first video shows the changing the input signal frequency. For each frequency, the signal data (scope traces) are saved into files. The second video shows once the data are saved, a calculation run can yield Bode plots: gain vs. frequency and phase vs. frequency.
voice annotation 1
voice annotation 2
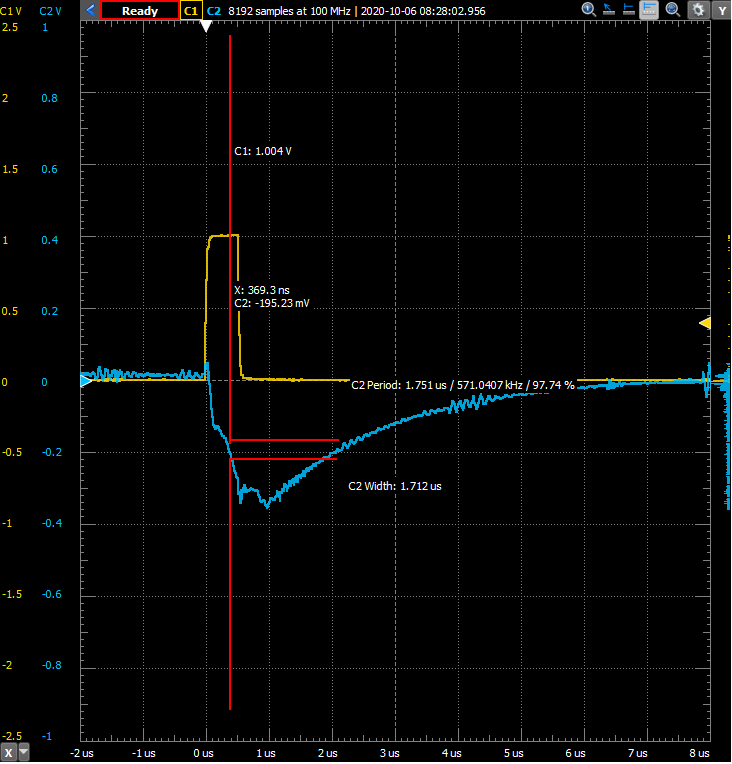
Part A: About step response and impulse response
Below is a video about step response for Step A.6
Below are illustrations of impulse responses
Concept of impulse response
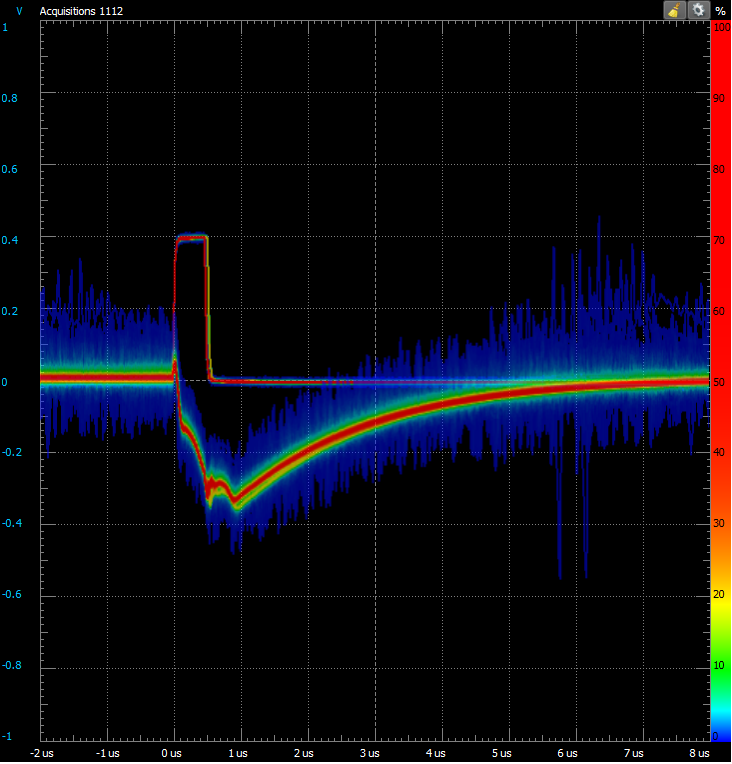
Impulse response vs. bandwidth
Continue to Part B