

|
|
ECE 2100 Lab. IV -
Dependent Sources -
Operational Amplifier
Voltage Amplifier, Transimpedance Amplifier Please
download these
items:
1. Lab 4 workbook and report 2. ECE_2100_Lab_4_guide_Part_0 ECE_2100_Lab_4_guide_Part_1 Special guide: ECE_2100_Lab_4_CircB_wiring_guide Special guide: ECE_2100_Lab_4_Part_1_Step_5_AD2_guide ECE_2100_Lab_4_guide_Part_A
ECE_2100_Lab_4_guide_Part_B
and C
see demonstration and write a report only) Continued from page 1 |
Page 2
Please go to update pages for the latest modification, class-wise issues, and others if links for those pages exist.
update page a update page b update page c
|
Lab work modification: - Do Part 0 ( Introduction), Part 1 (Instrumentation), and Part A only (three parts total): do everything, including answering/discussion all questions.- Experimental work of Part B and C are not required: It means no circuit, no measurement needs be done. You are required to only observe and write a report of your understanding, thoughts, and summary of these Parts. This should be put at the end of your report, a synthesis of everything that you learn in Lab 4. Create a subsection, titled "Report on observation of Parts B and C demonstrations". Do not mix this with what you summarize for your work in Part A. However, if you do anywork along the line of Part B and Part C, you are welcome to include for extra credit. |
Research
questions:
Based on the discussion above, we see that op amp can be used as a dependent source to certain extent (i. e. within certain limits), and which you will verify in your lab work. However, do you think that there is such a thing as an ideal dependent source that is absolutely "faithful" or has perfect fidelity with respect to the control input (the source that it depends on)? This leads to the key research questions below, which have a more important and wider implication beyond this lab that you should learn.
| How can
one use the operational
amplifier (op amp) as a
dependent source, and how "dependable"
is the "dependent"
source? What concepts, criteria can one introduce as metrics - or figures-of-merit for the "dependability" of a dependent source? (Here, we will explore the concept of signal "fidelity" such as the "fi" in "hi-fi" equipment, and the concept of temporal causality and frequency response). |
Components:
You will need:
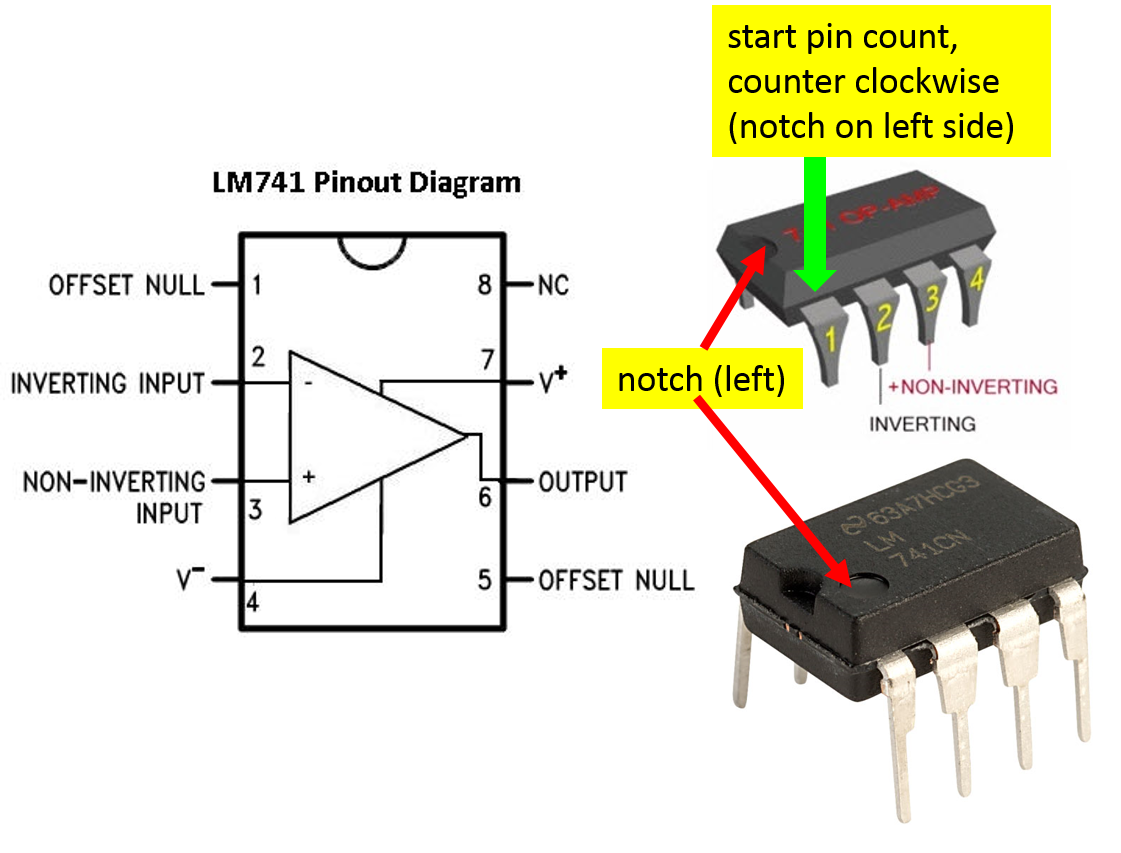
- One LM741 for each circuit. If you have a dual, or quad op-amp IC chip, then you need only one IC.
- Assortment of resistors as indicated in the circuits.
- For Circuit B: 1 kOhm, 10 kOhm, 27 kOhm, 100 kOhm (gain of 10, 27 and 100, or 10 dB, 14.3 dB, and 20 dB for amplitude). The highest gain, 20 dB is only necessary to amplify the small photodiode signal.
- For Circuit A:
a 2.7 kOhm (strong light
signals) or 10 kOhm (weak
light signals).
- A photodiode
for Circuit A, and also a LED so
that you can generate an optical
signal to test your photosensor.
The photodiode is a Silicon PIN,
it looks like this,
 ,
here is the
data sheet. Any LED will
do. You are also
encouraged to bring in a remote
control from home so that you
can see how and what "sms" a
remote control "talks" to a
piece of equipment.
,
here is the
data sheet. Any LED will
do. You are also
encouraged to bring in a remote
control from home so that you
can see how and what "sms" a
remote control "talks" to a
piece of equipment. - A
small black box or some thick black
paper to be rolled up into a dark
tube or something equivalent to
shield the photodiode from strong
ambient light. You can make a small
hole so that your test light sources
can be coupled in.
Main app for
the Lab:
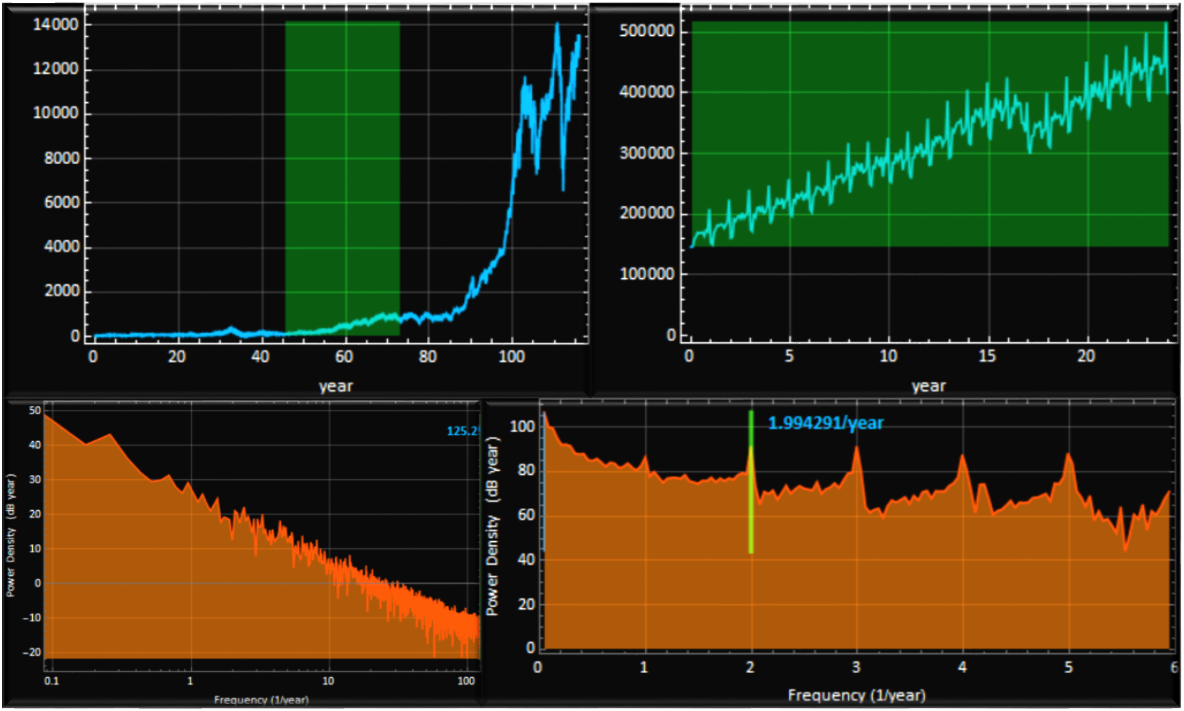
There is only one app to help you review some basic concepts of periodic signal while you are exploring how to use the function generator and the oscilloscope.
For those who have learned about Fourier analysis, there is an app for you to analyze signals, such as your voice, using computer.
Lab work:
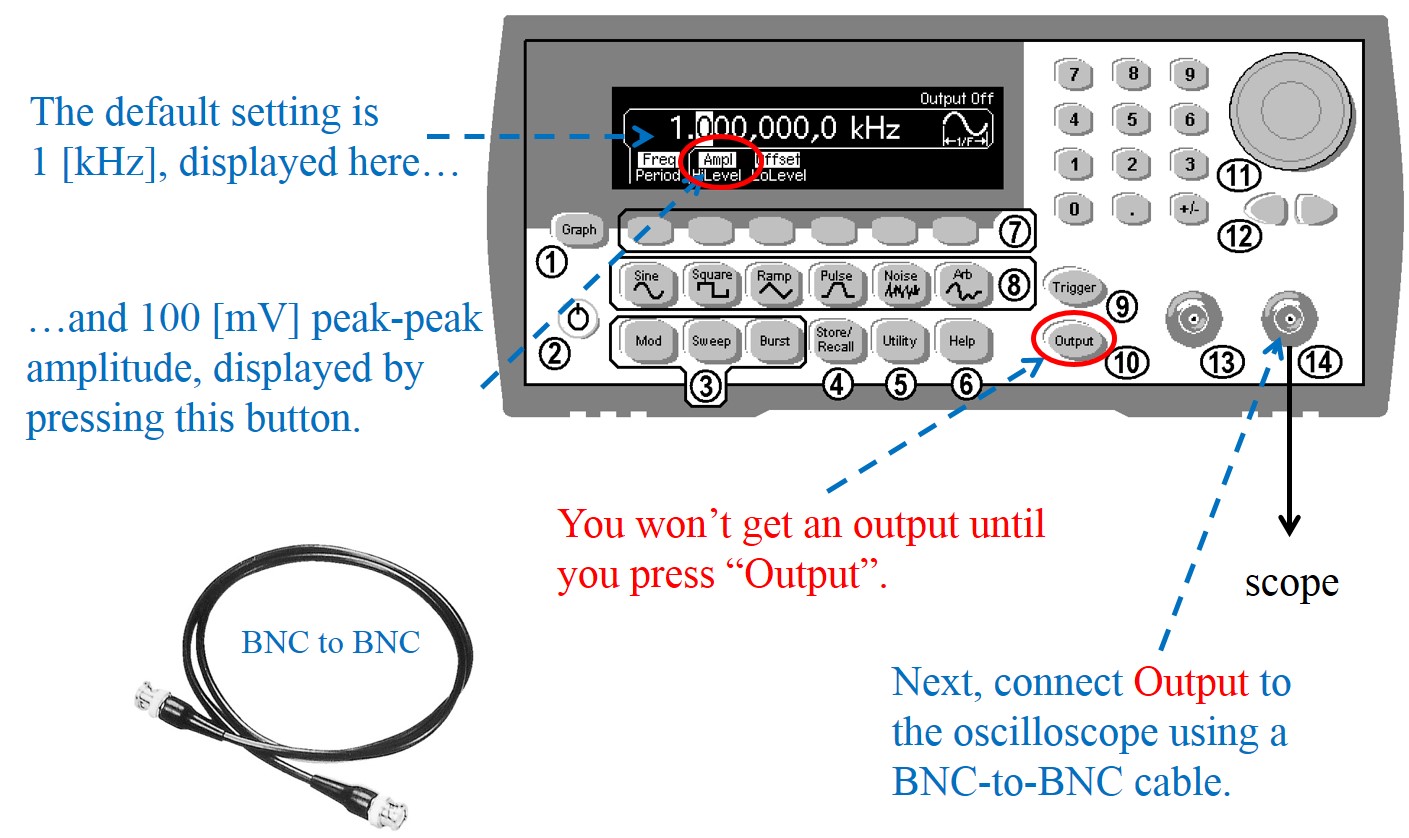
Step 1 - Check
out the function (signal) generator
and oscilloscope
Please
follow step-by-step instructions
of this
presentation ![]() .
.
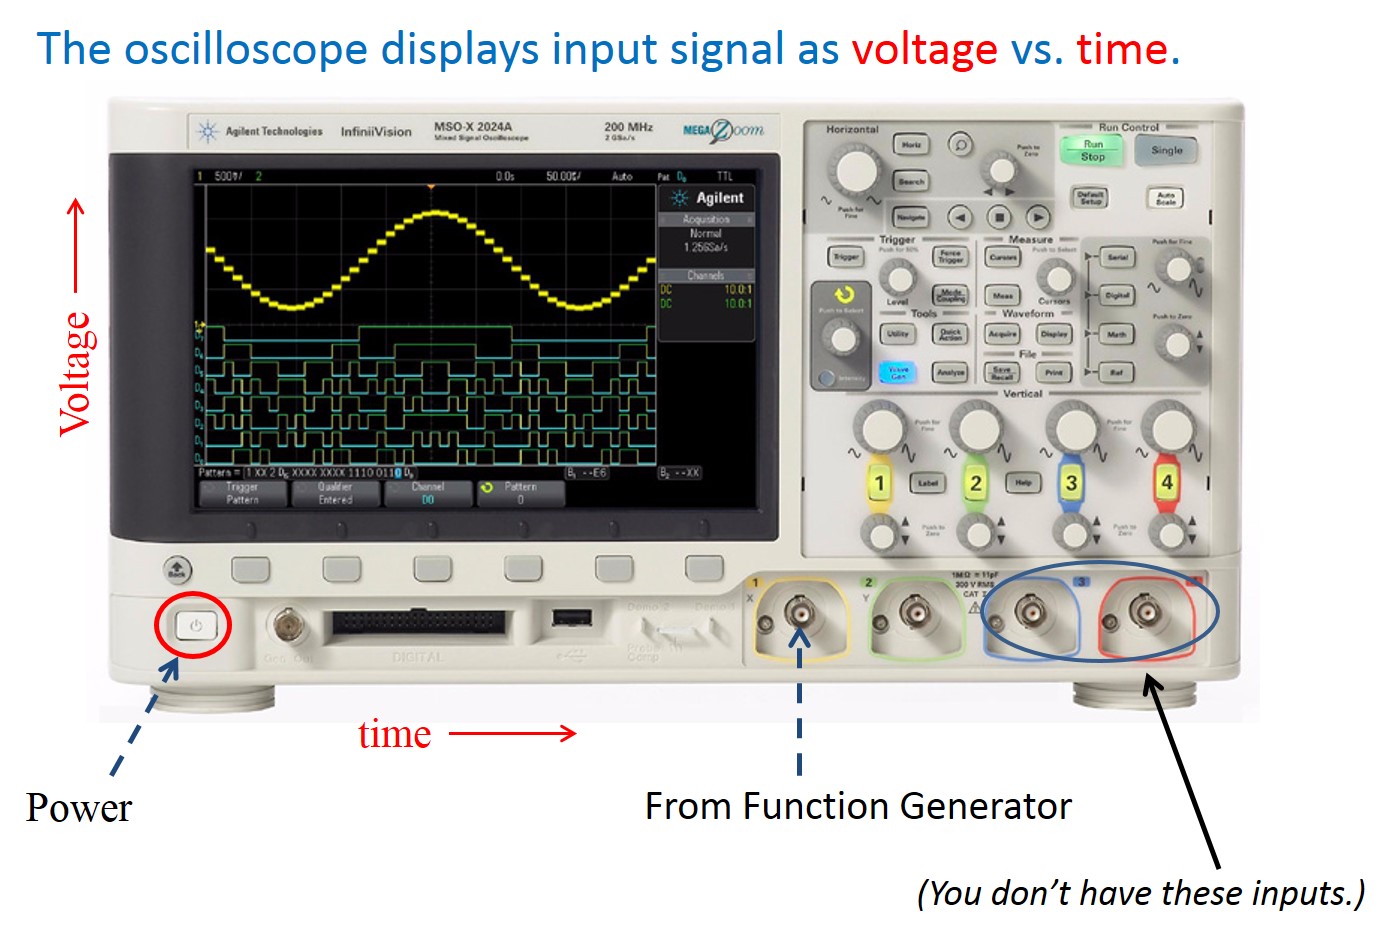
Verify that
you can generate the signals in the
table below and and observe them on
the oscilloscope. You can choose any
amplitude as you wish between 0.1-V
peak-to-peak to 2-V peak-to-peak (roughly).
Leave the DC offset at ~zero V.
Sketch this table in your lab
notebook, and just make a check mark
in each box that you have done.
| (signal
type/frequency) |
500 Hz |
5 kHz |
10 kHz |
50 kHz |
100 kHz |
500 kHz |
| sine |
||||||
| square |
||||||
| ramp |
Draw
in the lab notebook what you
observe on the oscilloscope
INCLUDING the amplitude and
time scales for a 10-kHz
square signal such that the
viewer can infer the amplitude
and frequency of your signal
and reproduce it with a
function generator. If you do
not wish to draw, we'll accept
if you:
- take a picture, print, crop
to show only the oscilloscope,
and paste.
- or save the waveform (.csv)
on a USB drive (or link
directly to your computer if
you have a driver to
communicate with it), use any
graphics software to plot,
print, and paste. Important: you cannot
take the data from another
team and pass it on as your
own.
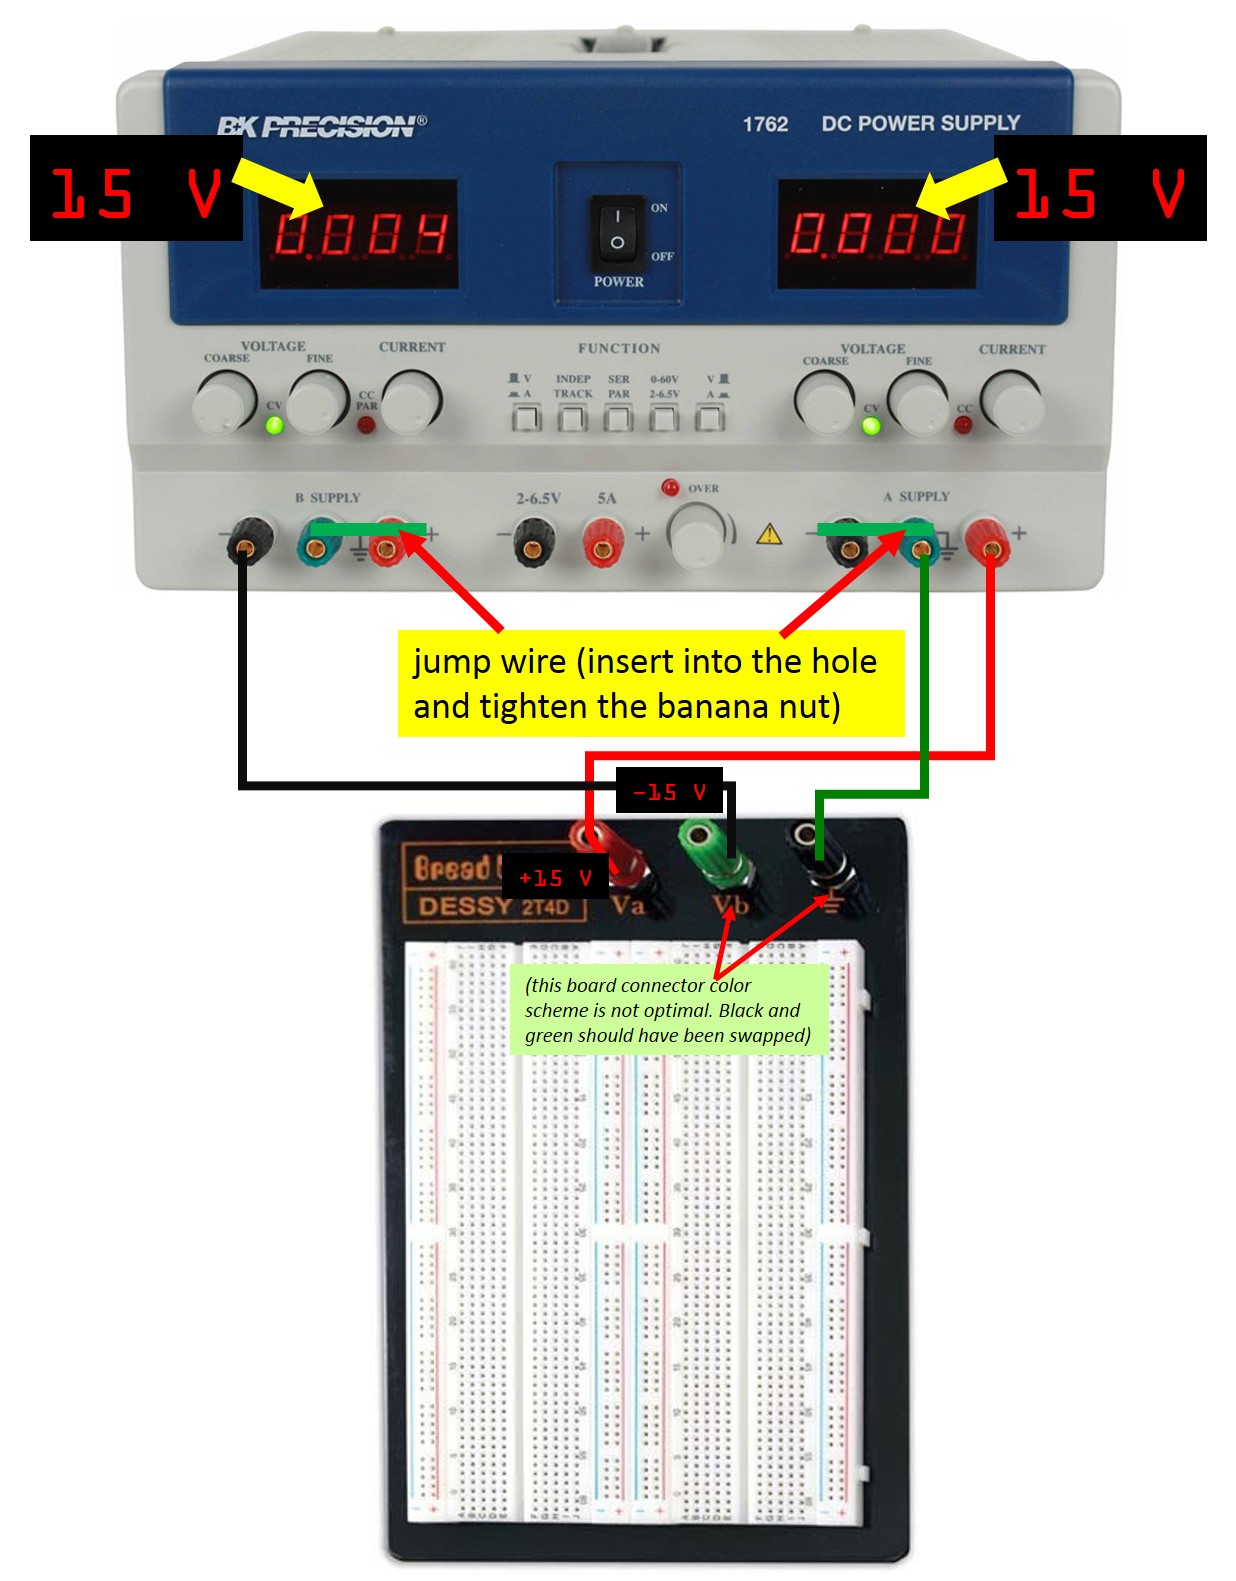
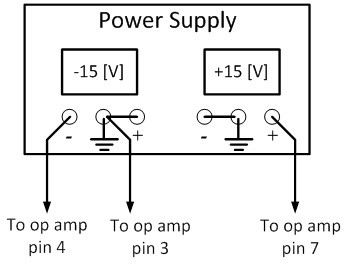
Step 2 -
Set up your power supply to give
+15 V, -15 V, and ground.
Step 3
- Build Circuit B (see page
1)
Build circuit B. Choose input resistor be 1 kOhm. Set up for 3 feedback resistors (Rfb): 10, 27, and 100 kOhm so that you can switch gain. Do not turn on your power supply yet until you finish and double check on the wiring.
See the pin layout below of
LM741. Please make sure it is correct
before turning on your +-15 V power
supply.
4.2
Generate a sine wave signal with f=500
Hz, 0.2-V peak-to-peak (see what you
did in Step 1 above),
and DC offset=0 V. Use a T-splitter to
monitor the signal on a channel of the
oscilloscope. The other split signal
is connected to the input of Circuit
B. Connect the output of Circuit B to
another channel of the oscilloscope.
You should see two signals: input and
output.
4.3
Sketch in your lab notebook the
signals with amplitude, OR capture the
scope output with a USB stick, plot,
print & paste (ppp) into
your lab notebook. Determine the gain
according to the formula:
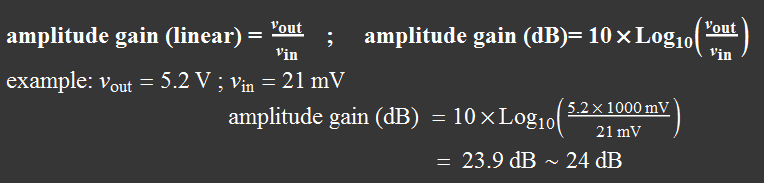
below
is an example how you can calculate
the gain:

Note
that "amplitude" here always means the
absolute value of the amplitude. If a
signal is negative, we let the minus
sign be its phase, which is ±Pi.
4.4
Use the scope built-in function to
measure the phase shift (or phase
difference) between the signals. Refer
to
the app in page 1 for the
convention about the sign of the phase
shift.
4.5 Change the gain by
switching the feedback resistor wire
that is connected to the 10-kOhm Rfb
resistor to the 27-kOhm Rfb. Do steps
4.3 and 4.4 again
Step 5 - Measurements of amplifier output saturation
5.1
Slowly increase the signal amplitude
from 0.2-V p-p to 2-V p-p. At which
point do you observe tell-tale sign of
amplitude
saturation? Report this in your lab
notebook.
5.2 Sketch in your lab notebook the signals with 2-V p-p on the scope, OR capture the scope output with a USB stick, ppp (plot, print & paste) into your lab notebook (the saturation clip-off at high and low voltage should be very obvious, if not there must be something wrong).
Step 6 - Measurements of amplifier bandwidth (see above)
6.1
Reset the signal amplitude to 0.2-V
p-p (still 500 Hz). You can choose
either Rfb=27 kOhm or 10 kOhm. Write
down the output signal amplitude.
6.2
Change
the frequency from 500 Hz to 500 kHz
as what you did in Step
1 above. At each frequency,
measure the output signal
amplitude, calculate the gain in
dB according to the formula in
4.3. Then plot
your data of gain vs. frequency
on log-dB scale (frequency on log
scale and gain(dB) on linear
scale). Draw a curve fitting
through the data and mark the
point where you think the gain is
approximately -3dB of the
beginning (500 Hz). The frequency at this
point is called the 3dB bandwidth.
-3dB ~ 1/2. It means your output
signal at that frequency is only ~ 1/2
of that at the lowest frequency.
6.3 Set the frequency at twice the 3dB bandwidth (e. g. if your 3-dB bandwidth is 120 kHz, generate a signal at 240 kHz), select square-wave output (leave amplitude alone, which should be ~ 0.2 V p-p). Sketch the waveform you see on the scope, or acquire them via USB, ppp into your notebook. Discuss what signal distortion you observe between the input and output.
continue to page 3