

|
|
ECE 2100 Lab. IV -
Dependent Sources -
Operational Amplifier
Voltage Amplifier, Transimpedance Amplifier Please
download these
items:
1. Lab 4 workbook and report 2. ECE_2100_Lab_4_guide_Part_0 ECE_2100_Lab_4_guide_Part_1 Special guide: ECE_2100_Lab_4_CircB_wiring_guide Special guide: ECE_2100_Lab_4_Part_1_Step_5_AD2_guide ECE_2100_Lab_4_guide_Part_A ECE_2100_Lab_4_guide_Part_B and C see demonstration and write a report only) |
Update page c
|
Lab work modification: - Do Part 0 ( Introduction), Part 1 (Instrumentation), and Part A only (three parts total): do everything, including answering/discussion all questions.- Experimental work of Part B and C are not required: It means no circuit, no measurement needs be done. You are required to only observe and write a report of your understanding, thoughts, and summary of these Parts. This should be put at the end of your report, a synthesis of everything that you learn in Lab 4. Create a subsection, titled "Report on observation of Parts B and C demonstrations". Do not mix this with what you summarize for your work in Part A. However, if you do anywork along the line of Part B and Part C, you are welcome to include for extra credit. |
Part B and Part C online reference
(continued from
update page a)
Below are html excerpts from ECE_2100_Lab_4_guide_Part_B
and C ![]()
Part C - Step 1
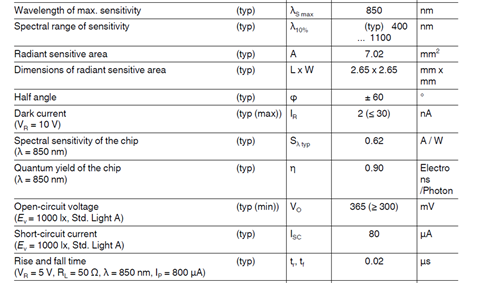
photodiode specification
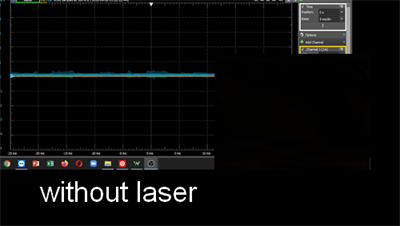
Test photodiode responsivity with laser backscattering experiment. The laser beam is shone on a target ~ 1.5 meter away (on the ceiling) and the photoreceiver signal is detected as shown below: laser off (dark current baseline), and laser on.
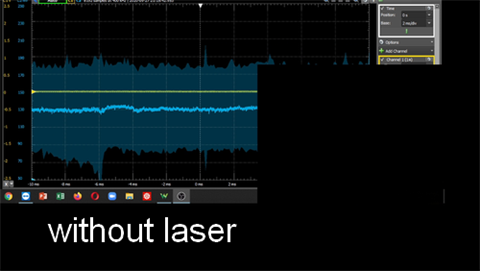
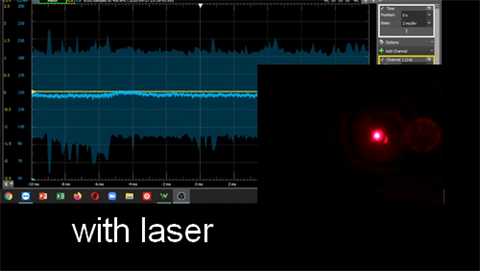
The difference of the photoreceiver signals with and without laser is a bit under 20 mV, corresponding to ~20 nA photocurrent.
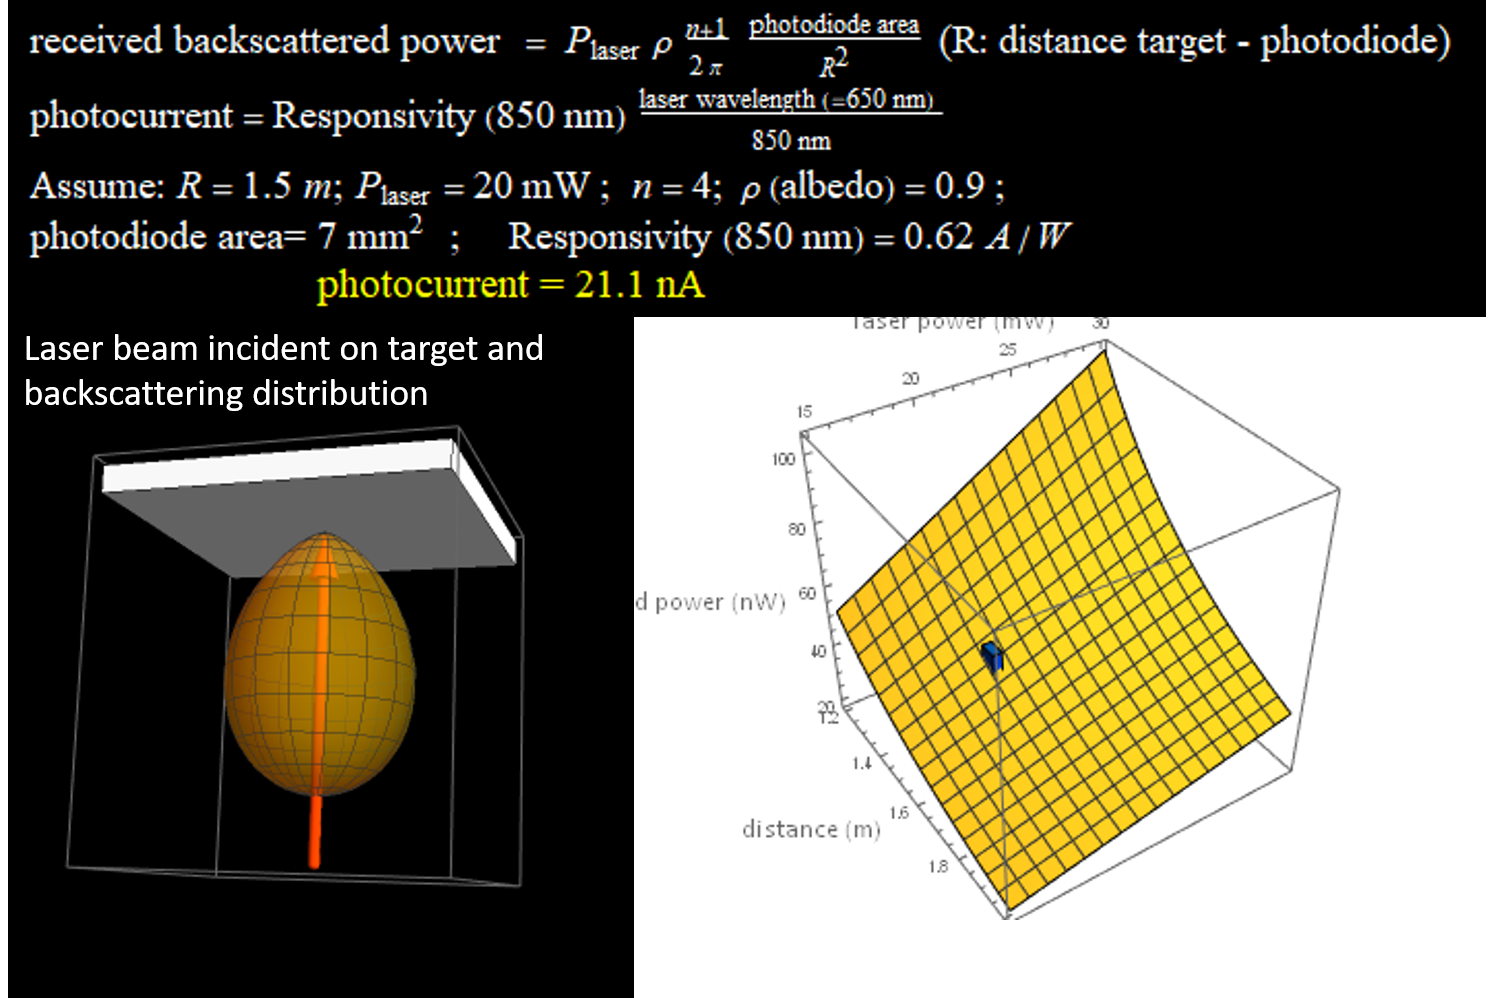
laser backscattering model
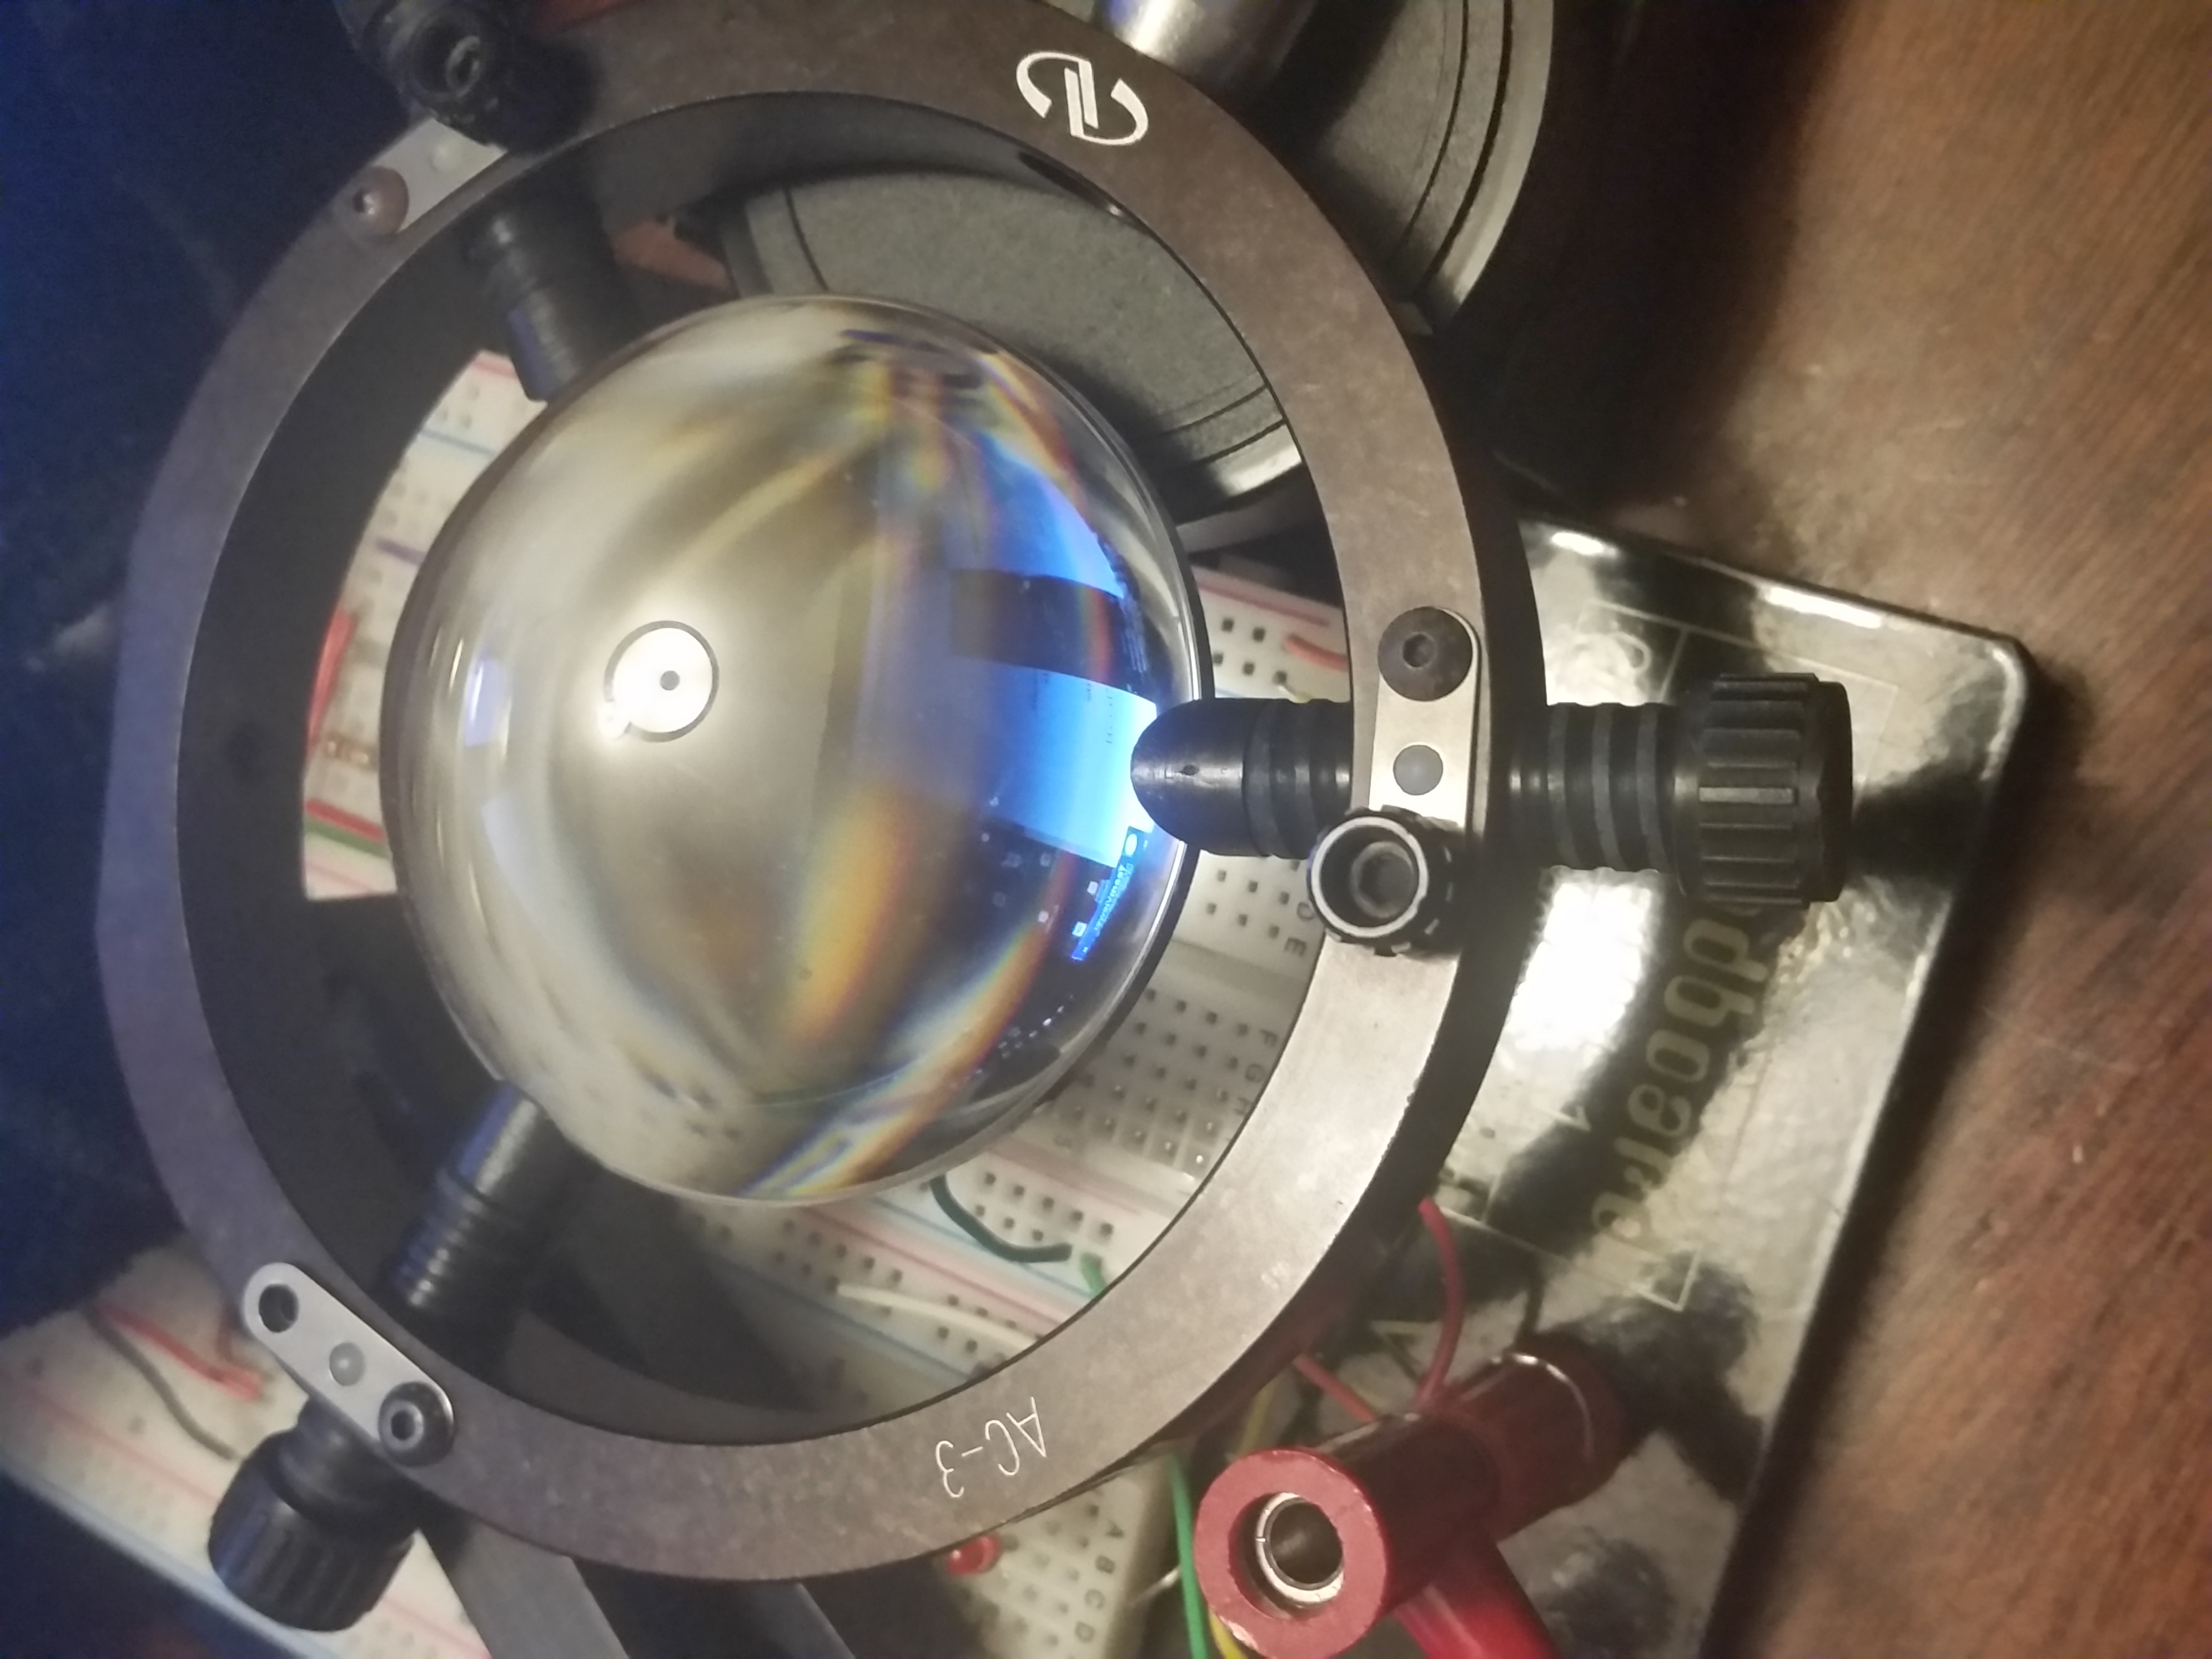
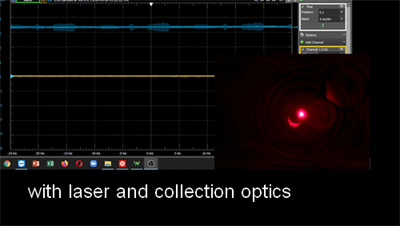
With the collection optics (lens), the photocurrent is more than 3 microamp, compared to < 20 na without the lens, an improvement > 150 times.
Part C - Step 2
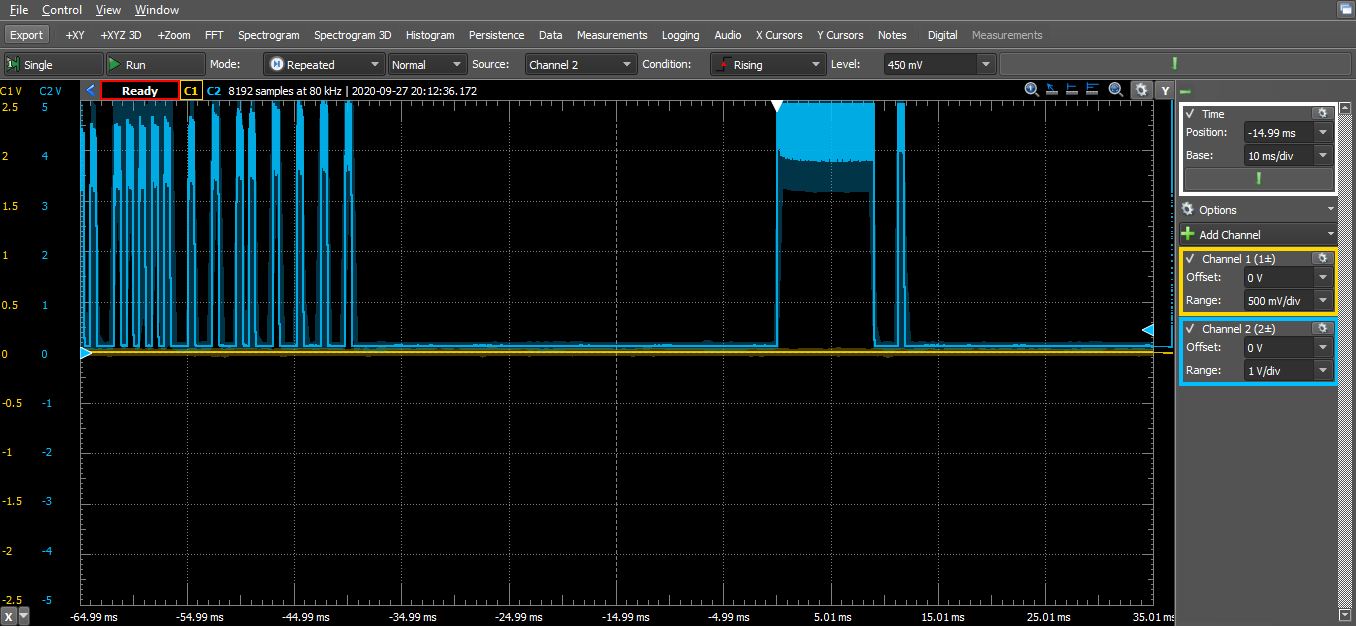
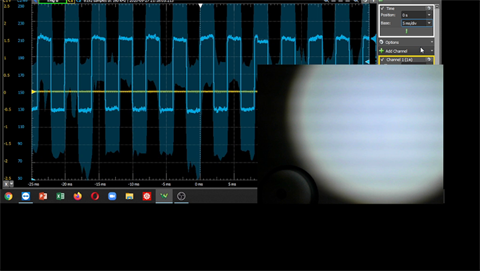
The figure below shows an entire message (command) the remote control sends out. It appears to use pulse width modulation format with a preamble at the beginning. Since the time base was large, i. e. a slow scope scan, to capture the entire message, fine temporal details of the signal cannot be seen. A higher time-resolved scan was obtained in the below.
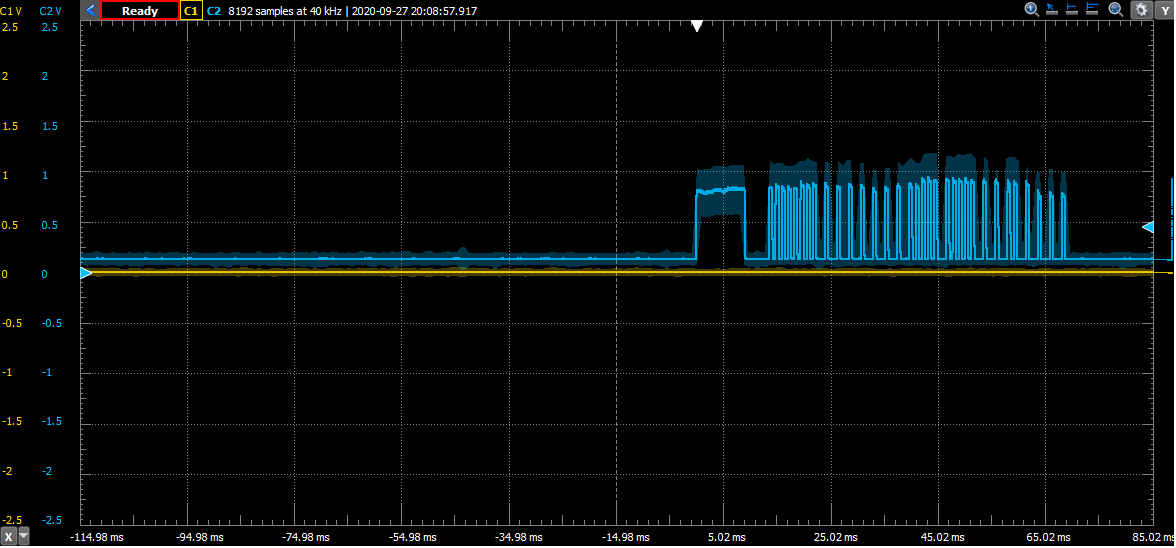
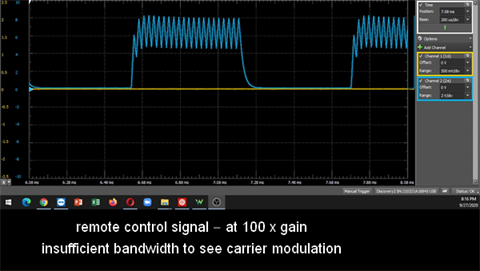
It appears in the figure below that there is intensity modulation in the remote control communication message.
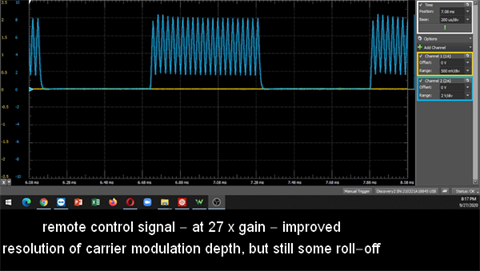
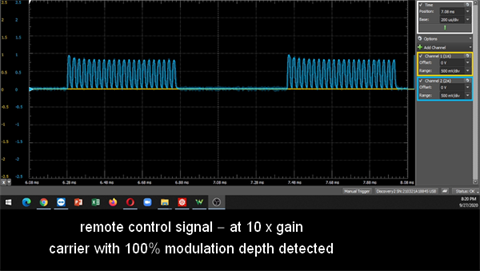
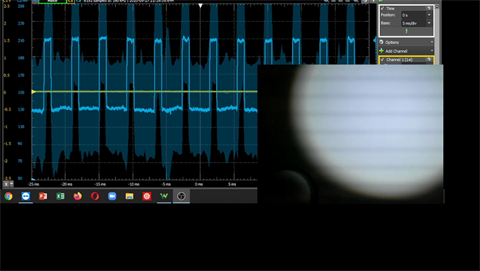
A finer temporal resolution shows that the intensity modulation depth is not 100%, in other words, the intensity never reaches 0 level in the figure. Since it doesnot make sense not to use 100% modulation depth, it means the bandwidth of the photoreceiver is insufficient to see the full modulation depth. Hence, lower gain for higher bandwidth can be used as shown in the subsequent two figures beneath.
Part C - Step 3
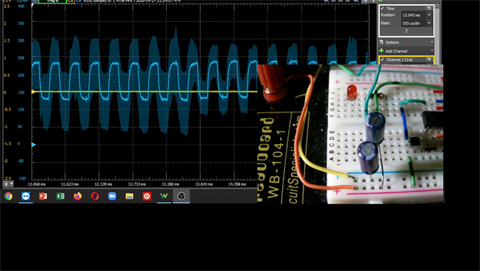
A LED flashlight was shown on a target (which is a ceiling), and the backscattered light on the photoreceiver was detected and recorded as the blue trace on the oscilloscope screen below.
A LED flashlight was shone on the ceiling, and its backscattered light was detected by the photoreceiver, which was shown as the blue scope trace. When the flashlight was set at the middle level of brightness, its light exhibited a square wave pattern. Evidence shows that when a low level of light output is chosen, the LED light does not change its highest level, but simply pulses the light at 50% duty cycle at 250 Hz. To the human eye, the brightness level is simply halved, but appears continuous.
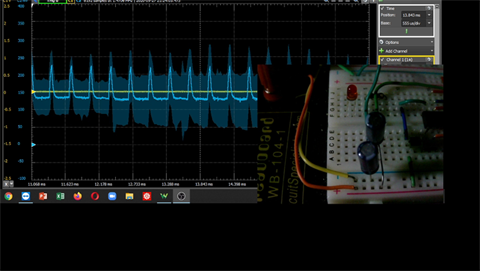
Likewise, for the same LED flashlight above, when the third level setting (dimmest light output) was chosen, the duty cycle was halved again to 25%. To the human eye, it merely appears dimmer.
A similar scheme of brightness control was found for a desk LED light. As evidence, the LED desk light was used to illuminate the circuit. Its light was detected by the photoreceiver as shown in the blue scope trace. Its light output was continuous at the highest level of output. But when set at the middle level of brightness, it was found to be pulsing at 100 Hz at 50% duty cycle.
At dimmer level, as
evidenced in the inset photograph, the
light pulse modulation was at ~10% duty
cycle.
Similar principle of brightness control was found in other LED lights, indicating that this engineering design is quite common and universal.
This Lab 4 shows two simplest uses of an op amp: to convert a current into a voltage, as demonstrated wtih the resistive transimpedance amplifier for a light detector circuit. The op amp is also used as a simple inverting-input feedback voltage amplifier, which in this case, is used to further amplify the signal from the transimpedance amplifier. Hence, the light-detector circuit demonstrated in Part B and Part C serves as useful illustration of the op amp basic properties for real life applications.