

|
|
ECE 2100 Lab. VI
- AC Signals, Linear
Circuits, and Second-Order
Filters
Please
download these
items:
1. Lab 6 workbook and report 2. ECE 2100_APP_Lab6_wiring_help ECE_2100_APP_Lab6_2nd_order_RC_filters Other useful app: |
Page 4
Please go to update pages for the latest modification, class-wise issues, and others if links for those pages exist.
update page a update page b update page c
| Lab work
modification: |
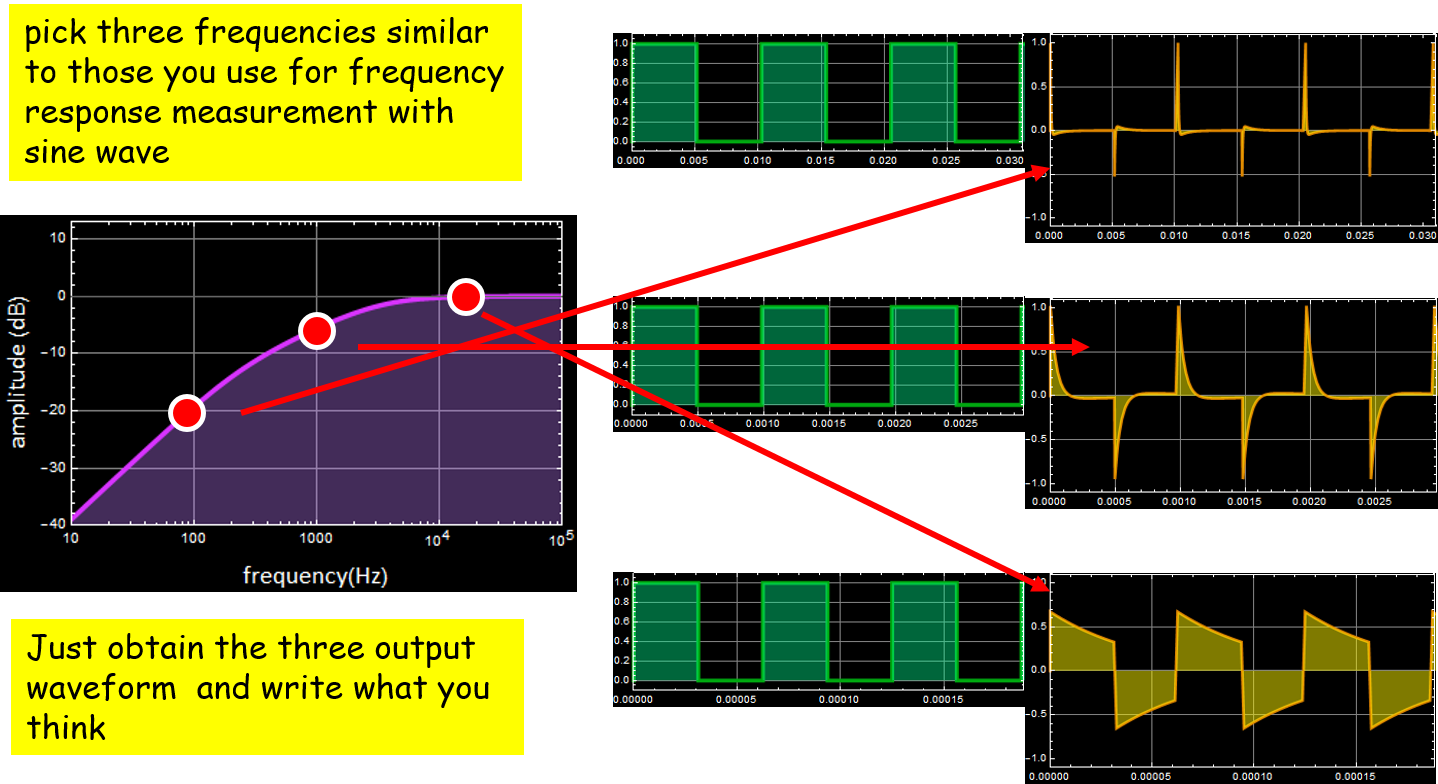
Part C: Band-pass filter
Step 0
Background on the band-pass filter
3D plot of bandpass filter transfer function. Red lines: contour of constant magnitude. Blue lines: contour of constant phase.

Part C
Step 1
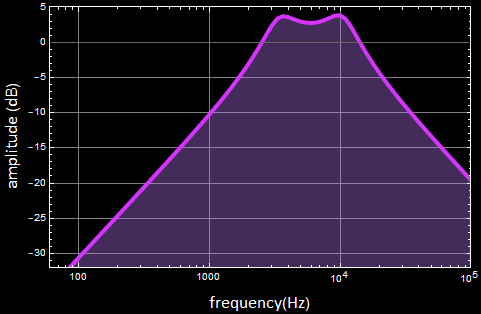
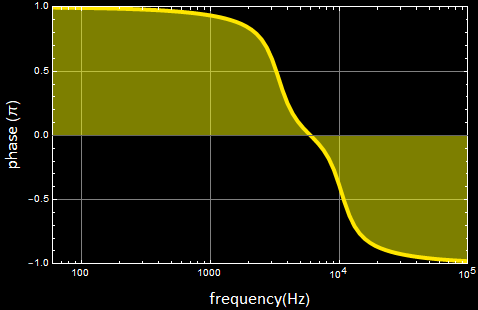
Frequency response: Please see the circuit simulation app for theoretical calculation, to be compared with experimental measurements. Below is an example: the results of the circuit in the photo.
Theory: From circuit simulation app:
Bode magnitude Bode phase
Experiment: For the actual circuit in the photograph:
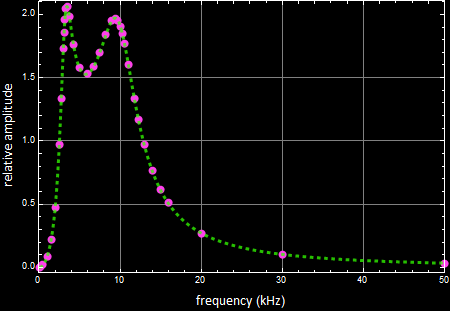
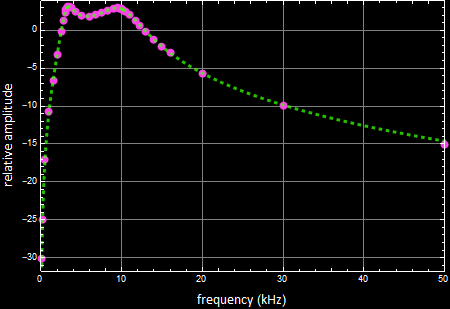
Bode magnitude Bode phase
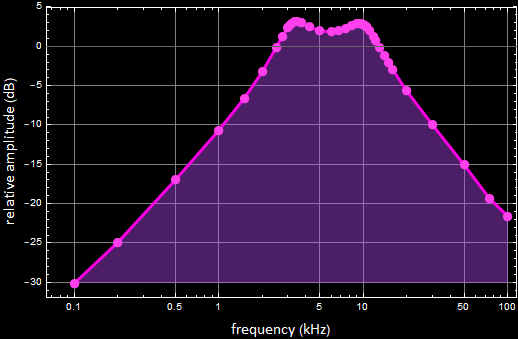
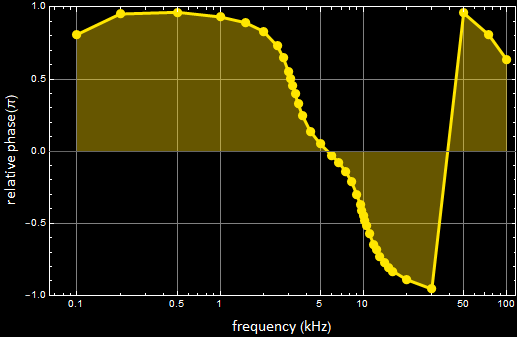
Theoretical fit of data (with fitted component values and actual op amp response) shows excellent agreement between theoretical model (dashed green curve) and experimental result (magenta points).
Theory: From circuit simulation app:
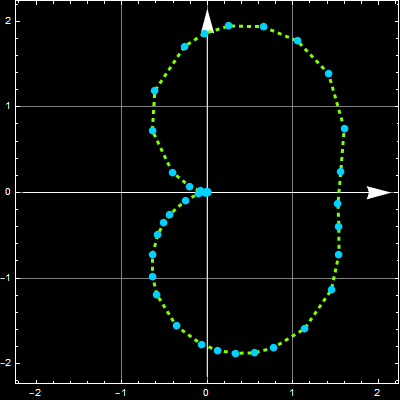
Nyquist 2D
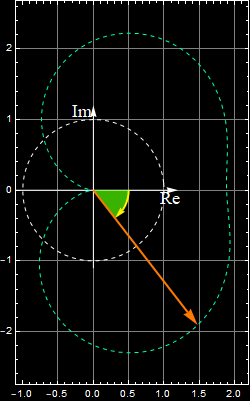
Experiment: For the actual circuit in the photograph:
Nyquist 2D Nyquist 3D (white horizontal arrow is Log frequency)

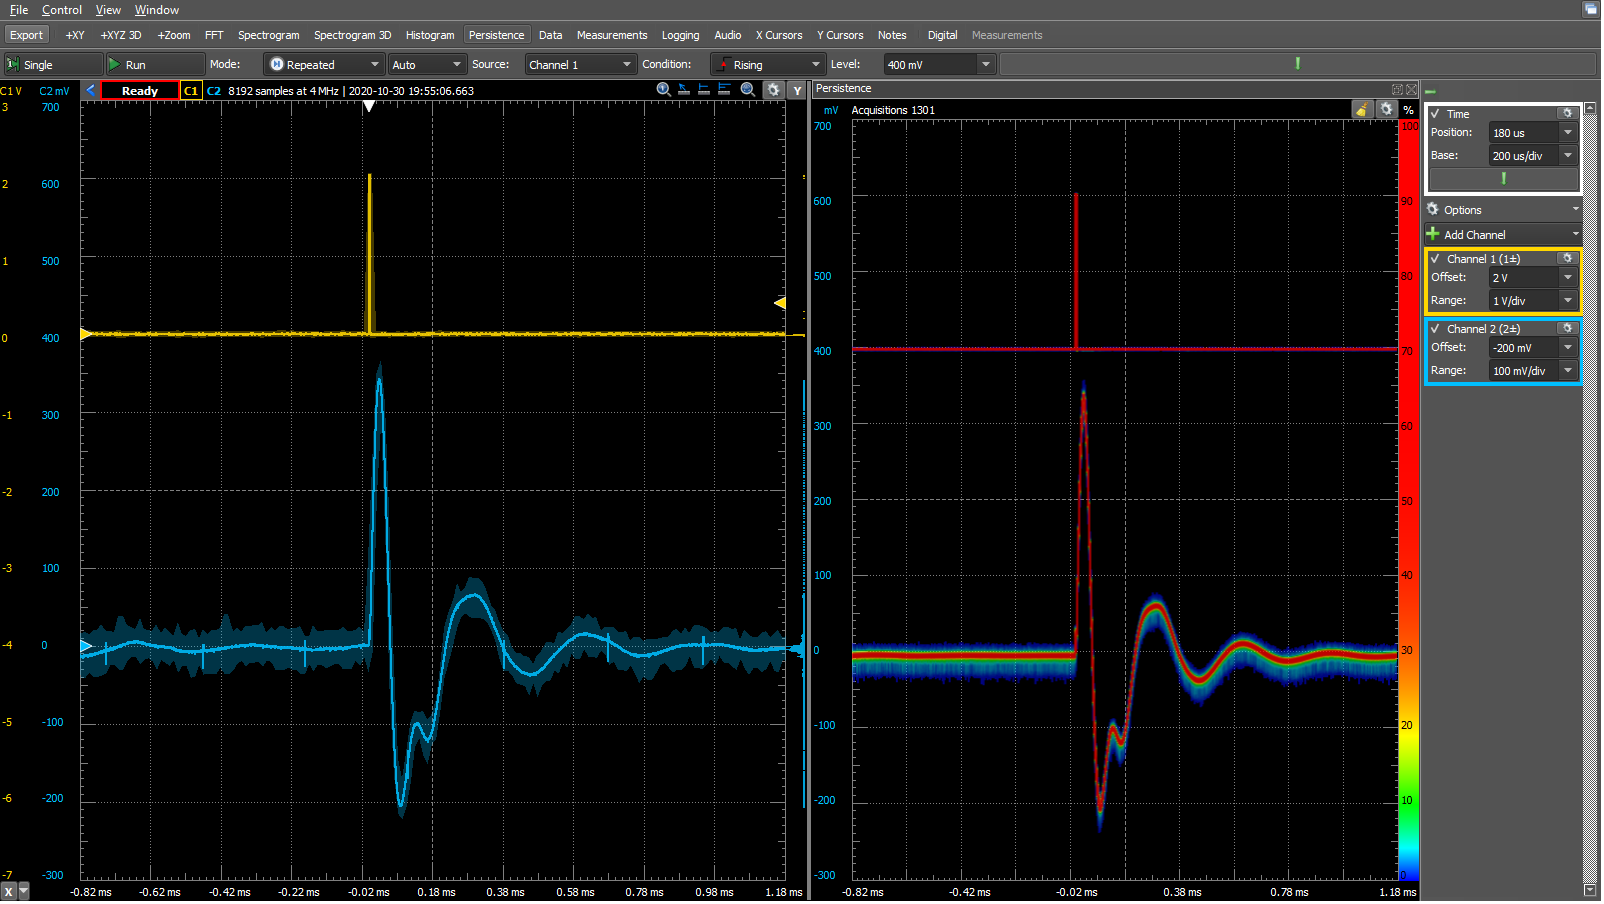
Step 2
Step response
Theory: Circuit simulation:
Experimental result:

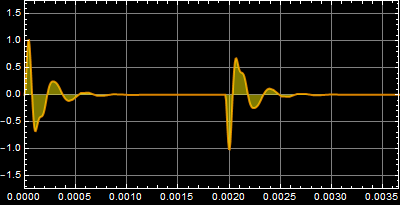
Step 3
Impulse response
End of Part C
Continue to page 5