
|
|
ECE 2100 |
Lab
Work
- Part A: Single-resistor circuit
We will start
out with resistors. We will
discuss more about resistors in
the lecture.

In this entire
course, you will always measure
and report (in your lab reports)
the values of the resistors you
use. One may wonder why we need to
measure a resistor while we can
easily read its value from the
color bands. The answer is that
the color bands only indicate the
resistor nominal value,
not actual value,
because of manufacturing
variation. Given a batch of
resistors, all with the same
nominal values, they can
statistically vary (i. e. differ
from each other) approximately by
as much as the indicated
tolerance, such as 1%, 2%, 5%, or
10%. All
resistors in your electronic kit
are of the 5% or 10% type.
Consider this
example. Suppose we use this
resistor.

Applying 5 V across it, we may
expect a current of:
i = 5V/4.7 kOhm = 1.064 mA.
However, when one measures the
resistor by itself, one finds out
that it is, say 5.1 kOhm instead
of 4.7 kOhm.
Then, the expected current is:
i = 5V/5.1 kOhm = 0.980 mA, not
1.064 mA.
The measured
current should be compared with
the latter figure to determine the
accuracy and precision. Since
an essence of this course
is to learn the good
practice of accurate and
precise experimental
measurements,
it is imperative to do
experimental analysis based on empirical
values - not
nominal (assumed) values of the
circuit elements.
We first
consider the circuit below.
| Schematic |
Breadboard wiring |
Fig. 1.1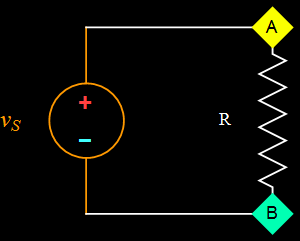 |
Fig. 1.2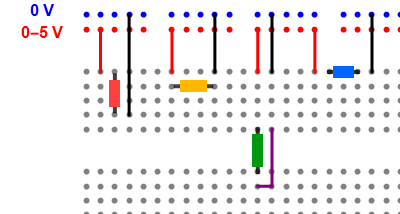 |
| Figure 1.1 above is
the simplest resistance circuit. Let
R= 100 Ohm or 120 Ohm - your choice
(resistors of these values are in
your electronic kit). The source
voltage is varied from 0 to 5 V. |
For lab work, we have
to wire the circuit on a breadboard.
Figure 1.2 above shows 4 possible
wiring configurations, the question
is: which of the 4 wiring
configurations represents the
circuit on the left? (select all
that are applied). You can try to answer by reading or watching the videos on page 1 about breadboard, then decide. Or you can just simply build the whole layout as shown on the breadboard and perform measurements to determine which ones are the correct ones. |
| If you build the
whole thing, you will need 4
resistors. Use two 100-Ohm's and two
120-Ohm's resistors from your kit;
it doesn't matter which one is 100
or 120 Ohm, make your choice.
However, as explained above, you
have to report the actual measured
resistance values with the DMM, and
not use the nominal values indicated
by the color bands. |
Work to be
done for Part A:
- build the correct wiring diagrams, or
- build
all 4 diagrams (the whole
layout in Fig. 1.2) and
discover the ones that
don't work. You should be
able to decide which one
is correct by simply
measuring the voltage
across the resistor as you
vary the source voltage
with your BK Precision
power supply.
- explain what's wrong with the
incorrect wiring diagrams in Fig.
1.2. Even if you choose to build
only the correct ones, you still
need to explain the incorrect ones
(why those don't work). Be
detailed and specific.
- select one that works, then measure the
voltage VAB (which is VA-VB) and
current through the resistor for
the following source voltage
values: 1 V, 3 V, 5 V. Plot the
current (x axis) vs. voltage (y
axis).
- when the source voltage is 5V,
use your finger to touch the
resistor and report if you feel
any difference when there is no
current. Explain your experience.
- apply Ohm's
law to determine its resistance,
and compare with the resistance
value you measure with the DMM.
- determine the relative
uncertainty using this formula:
(Rmeasured with V-I - Rmeasured
with DMM)/Rmeasured
with DMM.
- Part B: Single-LED circuit
For the
resistor circuit in Part A above,
if we don't look at the source
voltage indicator, or if the
source is a common battery, we
can't tell if there is a current
flowing through the resistor or
not (unless we have thermal
infrared camera). Here in Part B,
we will use an LED, which emits
light whenever there is a
current flowing through, which
is the phenomenon behind the LED
light bulb.
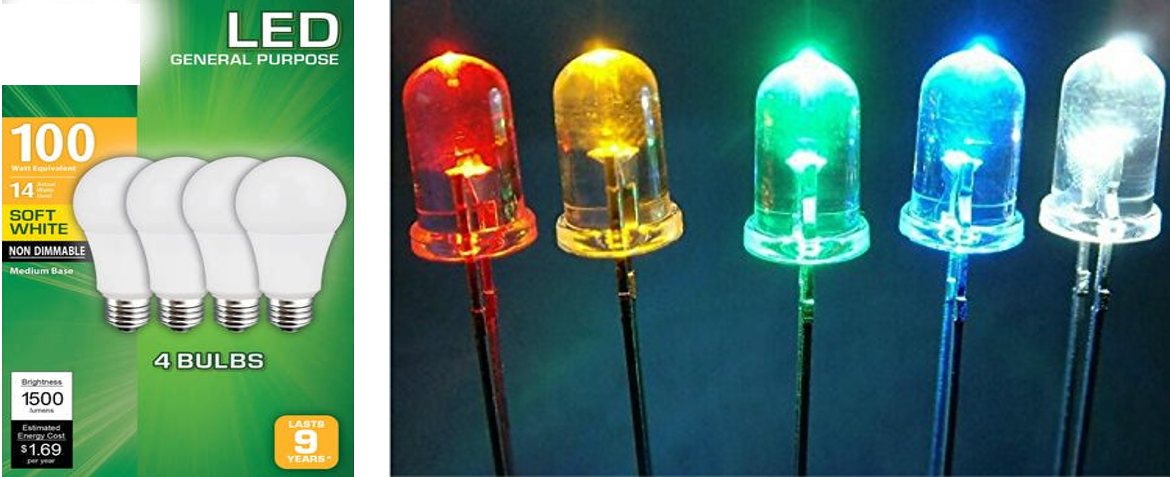
You will use the LEDs distributed
in class to do Part B. It is
recommended that you go to the
appendix, page i to see
how to do the measurement.
| Schematic | Breadboard wiring |
||||||||||||
Fig. 2.1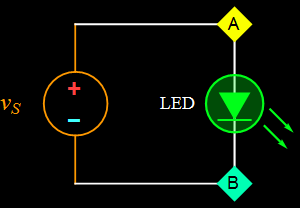 |
Fig. 2.2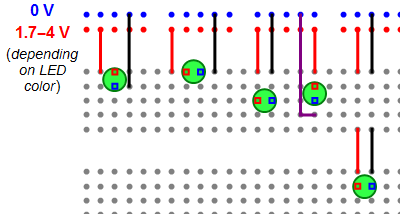 All LED's should be of the same color (your choice), and the voltage to be applied is shown below.
|
||||||||||||
| Note: LED is a diode,
which allows current to flow only
one way: from the anode (positive
terminal) to the cathode (negative
terminal). |
Figure 2.2
above shows 5 possible LED wiring
configurations. For the LED
(circle), the red square indicates
its anode (positive terminal, long
leg) and the blue, its cathode
(negative terminal, short leg). The question is: which of the 5 LED wiring configurations above will work, i. e. emit light. In fact, if you wire all 5 as shown, you will see that none of the LED will light up, and the power supply will indicate it is short-circuited. By removing just one wire, you will see that the power supply is no longer shorted, and some LED's will emit light. |
Work to be
done for
Part B:
- build only the correct ones; Or
- build the whole layout as shown on the
breadboard (Fig. 2.2); and by trial and
error or use your breadboard knowledge,
remove one wire to determine which wiring
configurations are the correct ones.
- explain why some wiring configurations
work and some don't.
- select one that works, perform an I-V
measurement based on the graph below with
at least six data points (detailed
explanation in the lecture and go to the appendix,
page i for suggestion).
Plot the result. Note: this graph is only
nominal. Actual LED's have significant
deviations from these I-V curves because
of LED material and manufacturing
variations.
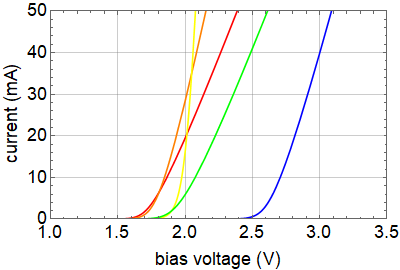
These curves were calibrated for a large batch in the past, the new LEDs may have different behavior and these curves should be used only as a guide.
- Part C: Resistor and LED circuit
For the
resistor circuit in Part A above,
if we don't look at the source
voltage indicator, or if the
source is a common battery, we
can't tell if there is a current
flowing through the resistor or
not (unless we have thermal
infrared camera). Here in Part B,
we will use an LED, which emits
light whenever there is a
current flowing through, which
is the phenomenon behind the LED
light bulb.
Fig. 3.1 Figure 3.1 above shows the operation of a simple R-LED serial circuit. The resistor can be used to control the current. As the resistance increases from 50 - 200 Ohm, the current flows through the LED decreases and its brightness also decreases. |
|
Fig. 3.2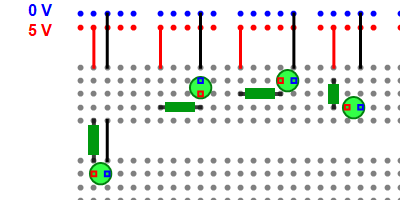 |
Figure 3.2 shows 4 possible wiring configurations for the schematic in Fig. 3.1. For the LED (circle symbol), the small red square indicates its anode (positive terminal, long leg) and the blue, its cathode (negative terminal, short leg). The resistor and the LED are supposed to be in series. The question is: which of the 4 R-LED wiring configurations will work, i. e. the LED will emit light. |
For the measurement of Part C:
- Select LEDs
of the same color to build
the R-LED circuit that works with
resistor value such that the LED
current is between 15
and
25 mA max (a few mA higher or
lower is OK, don't worry too
much). Use the app (click on links
associated with the gif to
download the cdf version or the Mathematica
notebook icon for .nb file) to
determine the resistor that you
will use. Note that each LED color
may need its own resistance value.
- you can
build only
the one that you know will
work, OR all
four circuits and determine which
one works, which one doesn't.
- explain those that don't work.
- measure the LED current, its
voltage, and the resistor voltage
for the one circuit that works.
- does Ohm's law hold for the
resistor? (as explained in the
lecture, state the % of
measurement uncertainty with
regard to Ohm's law).
Continue to next page (3)