

|
|
ECE 2100 Lab. V -
Capacitors and RC Circuits
Please
download these
items:
1. Lab 5 workbook and report 2. ECE_2100_Lab_5_guide_Part_0 ECE_2100_Lab_5_guide_Part_A ECE_2100_Lab_5_guide_Part_B_C ECE_2100_Lab_5_circuit_simulation |
Please go to update pages for the latest modification, class-wise issues, and others if links for those pages exist.
update page a update page b update page c
| Lab
work modification: TBD
(after class survey and Lab
4) |
Lab work (continued)
Part A (continued):
Step 2: Build the op-amp oscillation circuit: RC time and oscillation frequency
Review what was learned in Lab 4: impulse response behavior in time domain vs. frequency response in the frequency domain
Circuit wiring
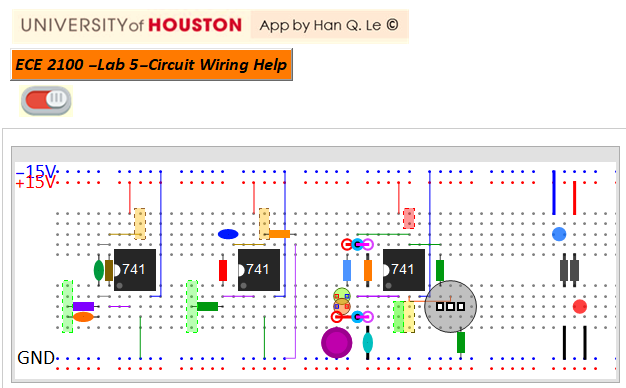
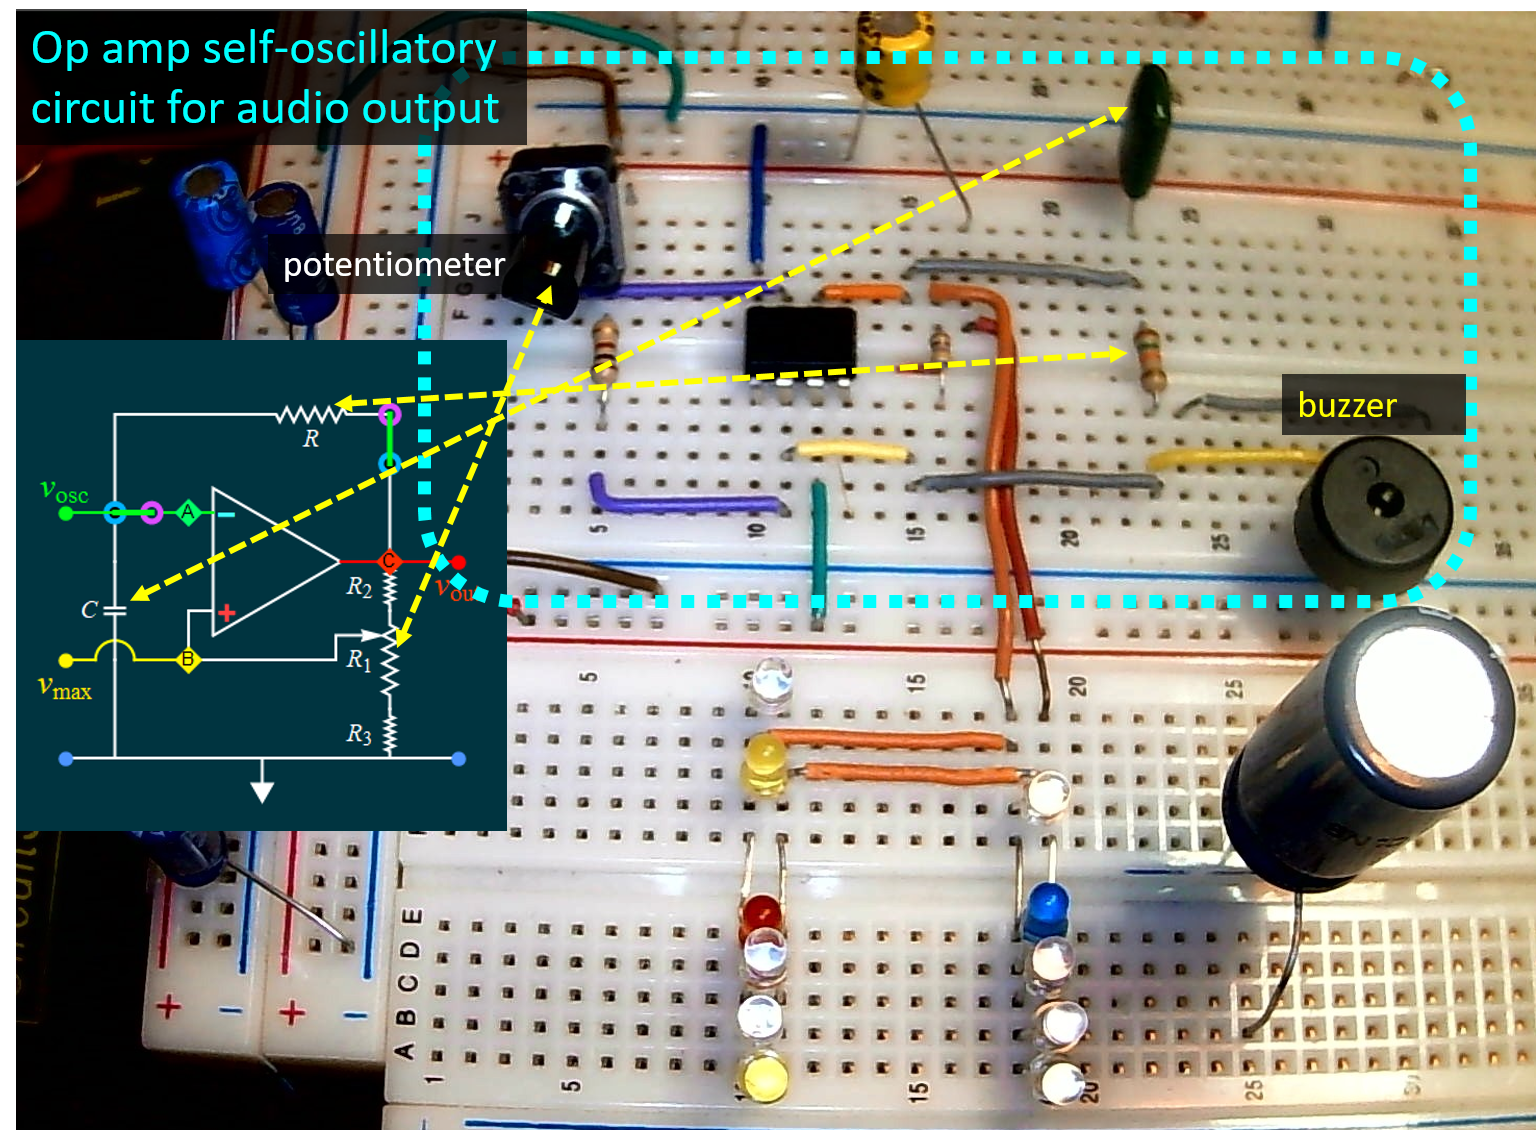
Step 3: Configure and test the op amp self-oscillation circuit for audio frequency output
For a basic concept understanding, see the computer simulation below. You are not required to understand the mathematics behind the circuit, which is a bit more complex than the simple RC problem, although not much more.
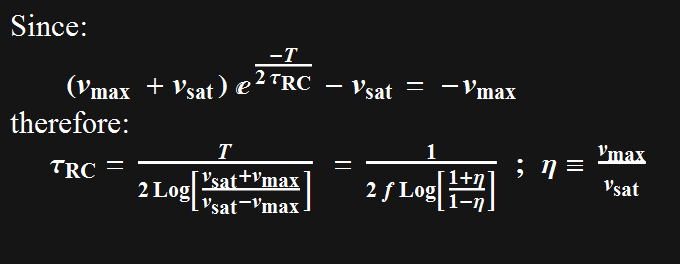
The key task of this step is related to the equation below. You are not required to understand the whole thing. The only relevant item is the last equation that links the RC time Subscript[\[Tau], RC] to oscillation frequency f. The RC time is fixed, but the frequency can be varied by controlling the voltage level determined by the potentiometer.
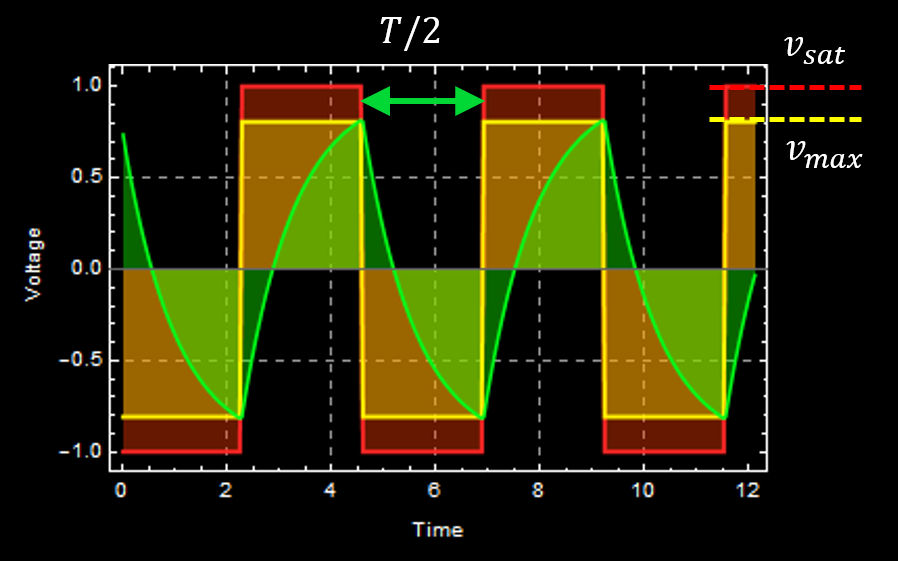 |
Vary the potentiometer through several values (minimum 5) such that the audio frequency ranges from the lowest to the highest. At each value, measure (from your scope traces) \[Eta], the ratio of vmax to vsat. Look at the gif link below to see how the frequency is varied.
Then, plot 0.5/Log[(1+\[Eta])/(1-\[Eta])] (y axis) vs. f (x-axis). Estimate Subscript[\[Tau], RC] from the plot, and compare to R*C of your components. If you don't have access to the Lab DMM, you don't have to measure C, but you can read off the value printed on it, and use the resistor band code to read R, or use a home DMM if you have one.
Complete your report with all the evidence of your work, from circuit to measurements, data analysis, and multimedia evidence if you provide links. Do NOT embedded large audio-video files in your report. It is your responsibility to ensure that the links to your multimedia files work.
Below is a link to a demo. There is no need for a buzzer if you use option "Audio" in the Scope function of Digilent Waveforms software.
Step 4: Configure and test the op amp self-oscillation circuit for LED driving output
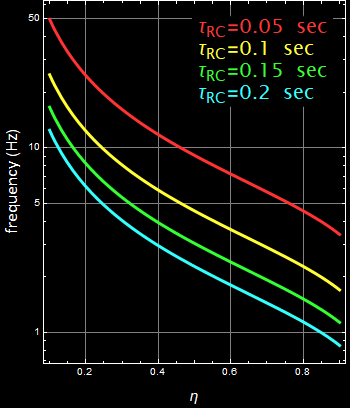
Use the graph below to choose your R and C. Select the largest bipolar electrolytic capacitor you have. Then, find a R value such that R C time is in the range of the graph below. This graph does not include LED differential resistance, hence, the actual frequency will be lower than shown below. Treat the frequency as the upper estimate limit
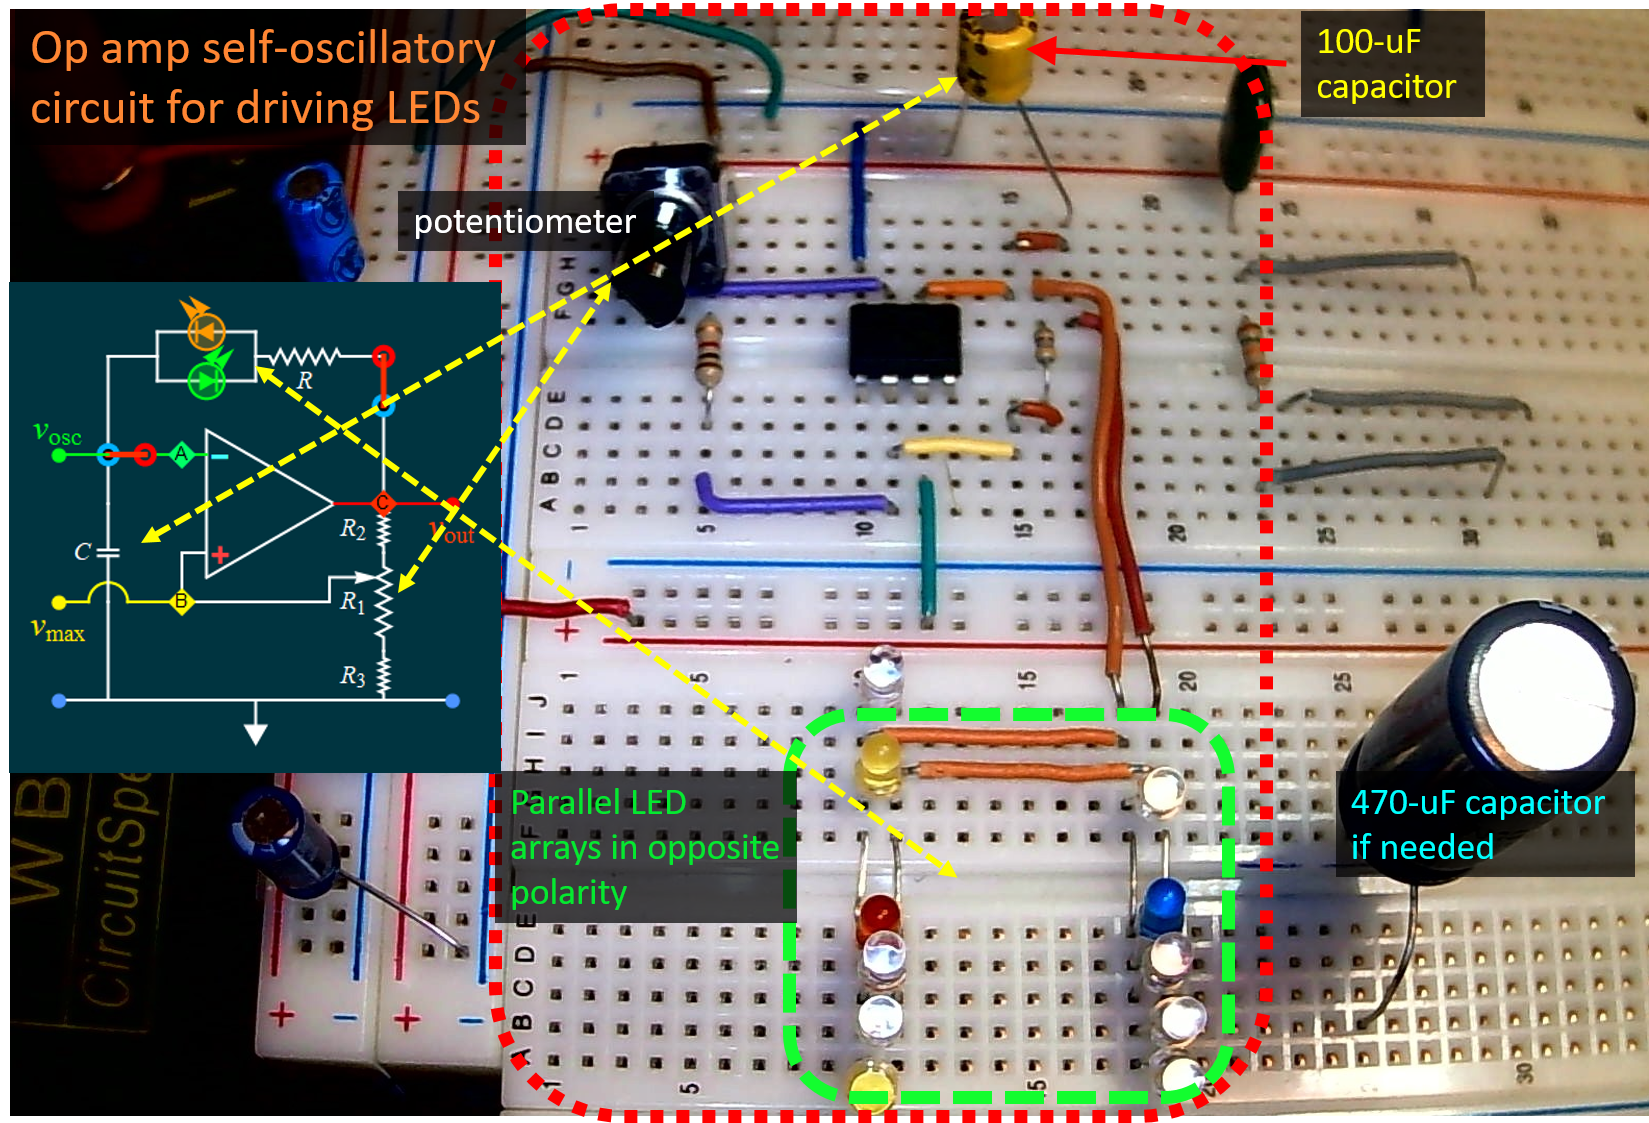
See the link below for a computer simulation. It is a good example of numerical non-linear differential equation solving. You can also download an app to test your circuit. However, the calibration for the LED in the app is for old LED types and might be very different from yours.
Do a measurement and analysis similar to the previous step on frequency, but here, you need not do more than 3 frequencies, a slow blinking rate less than 1 Hertz, a rate between 1 and 5 Hertz, and a faster one above 5 but no more than 20 ish Hertz. Set up the AD2 to do various measurements, and be proactive in your learning by choosing what to measure that will help your understanding.
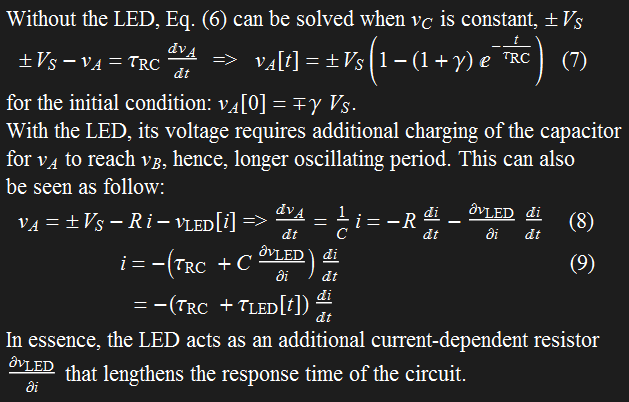
There is no need for plot, because it is quite complicated with the LED behavior as explained below. Just report the results.
Additional note (for the advanced student):
Below is a link to a demo.
Extra learning activities:
The goal of learning is to explore, try, and put 2 and 2 together, besides just follow instructions and do what are prescribed. Below are examples of putting two and two together, and you are strongly encouraged to develop such learning habit and approach.
Use the op amp self-oscillatory circuit to drive
the rectifier circuit in Lab 2
Use the photoreceiver of Lab 4 to study the LED behavior of the op amp self-oscillatory circuit
Complete your report with all the evidence of your work, from circuit to measurements, analysis, and multimedia evidence if you provide links. Do NOT embedded large audio-video files in your report. It is your responsibility to ensure that the links to your multimedia files work.
End of Part A
Continue to page 3