

|
|
ECE 2100 Lab. V -
Capacitors and RC Circuits
Please
download these
items:
1. Lab 5 workbook and report 2. ECE_2100_Lab_5_guide_Part_0 ECE_2100_Lab_5_guide_Part_A ECE_2100_Lab_5_guide_Part_B_C ECE_2100_Lab_5_circuit_simulation |
Please go to update pages for the latest modification, class-wise issues, and others if links for those pages exist.
update page a update page b update page c
| Lab
work modification: TBD
(after class survey and Lab
4) |
Lab work (continued)
Part C
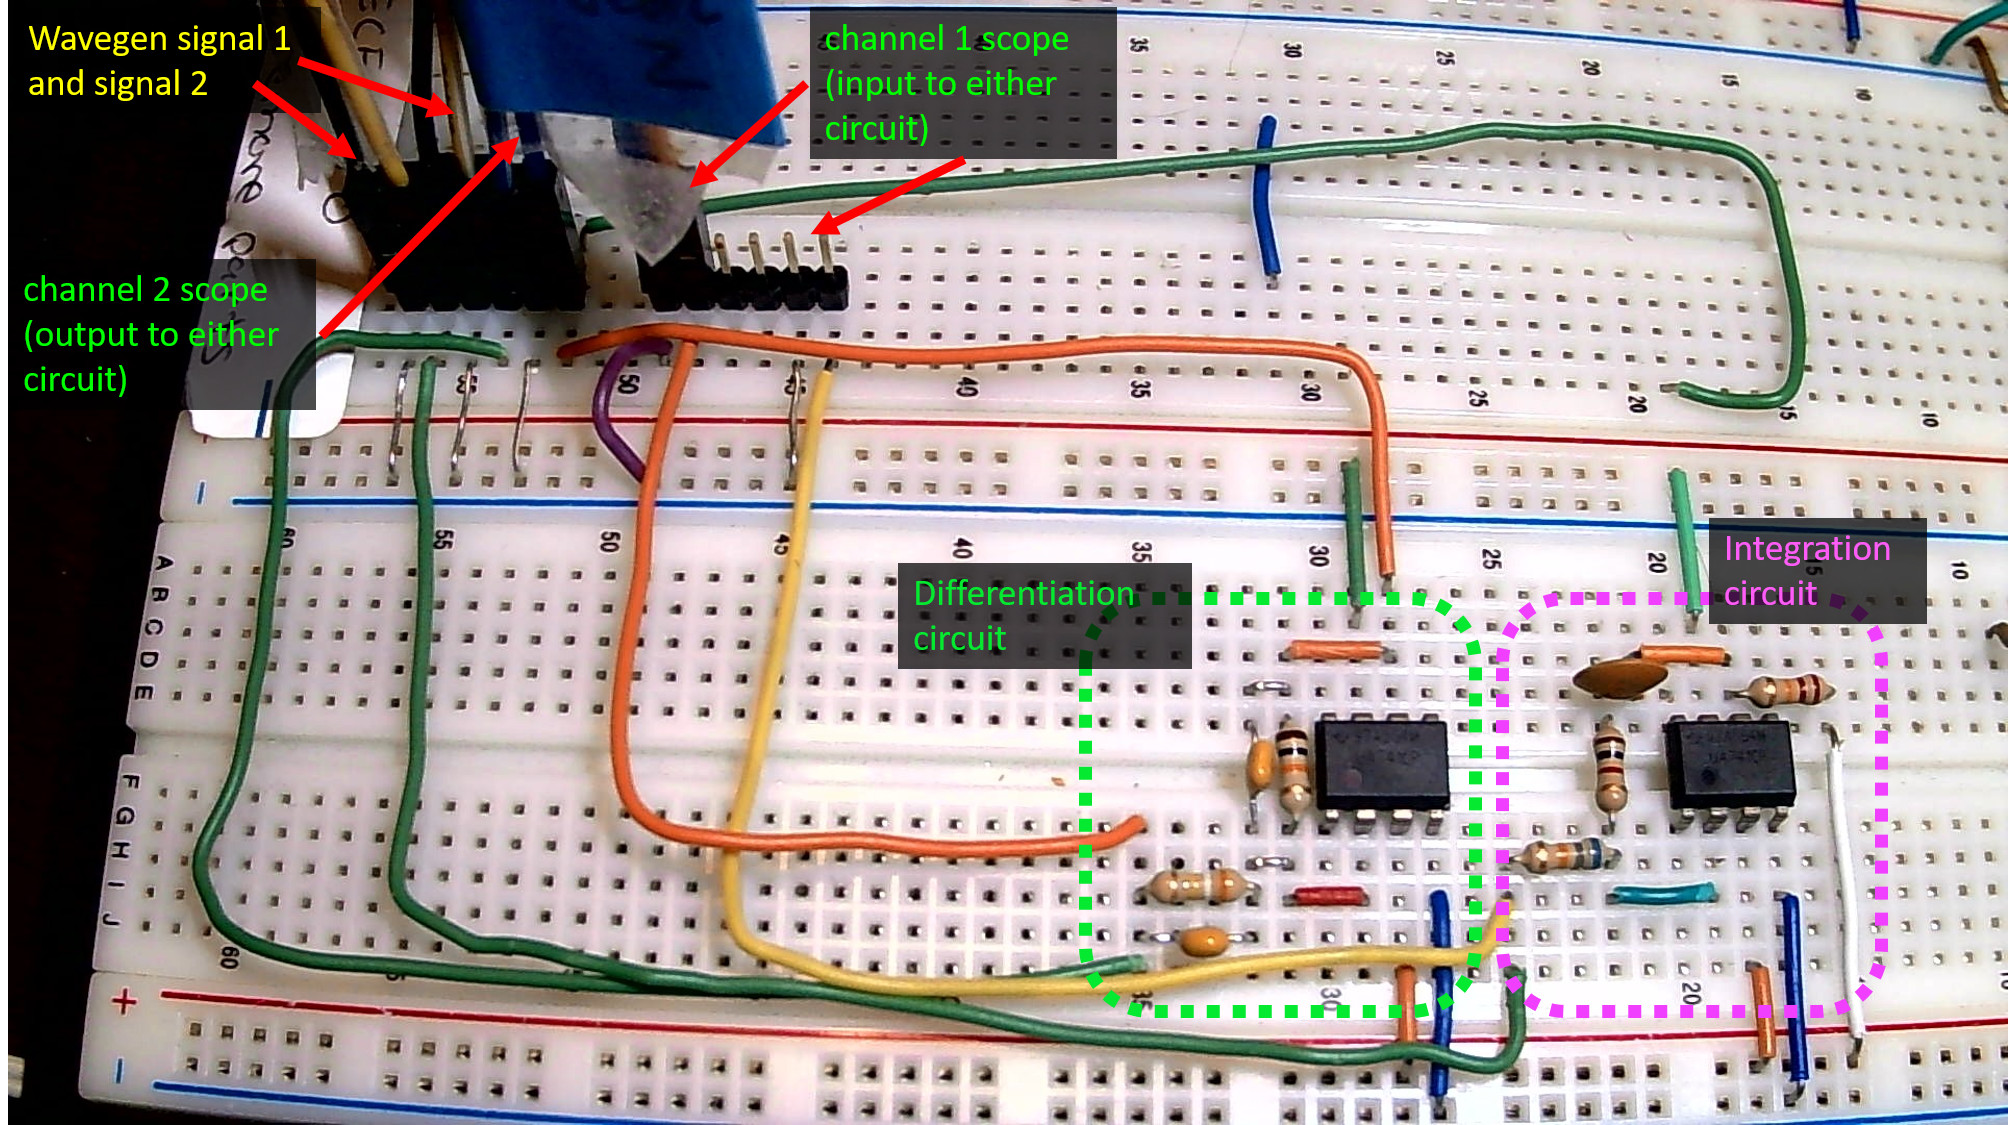
Step 1: Build the op amp integration circuit
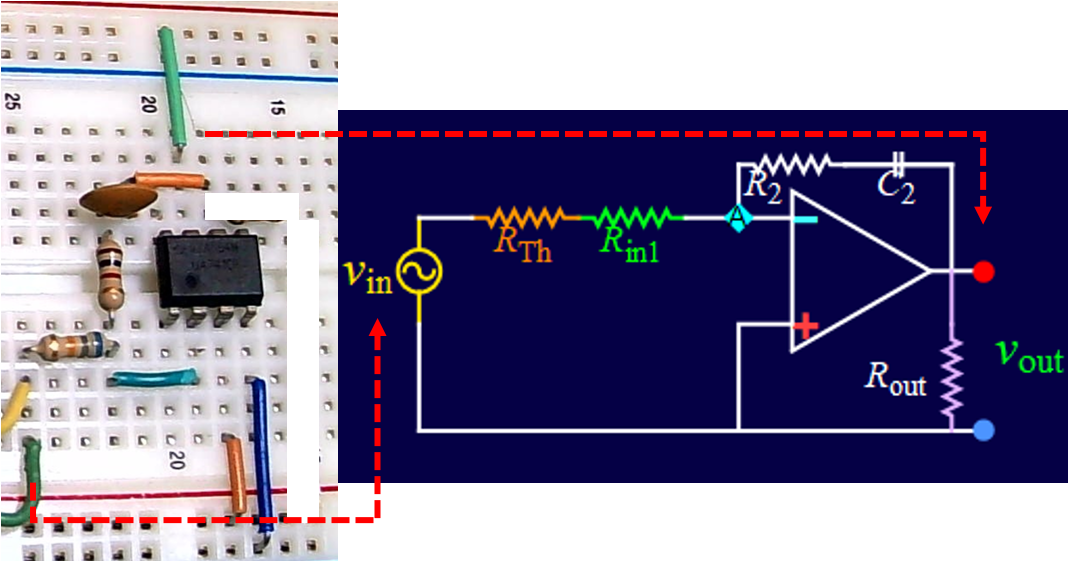
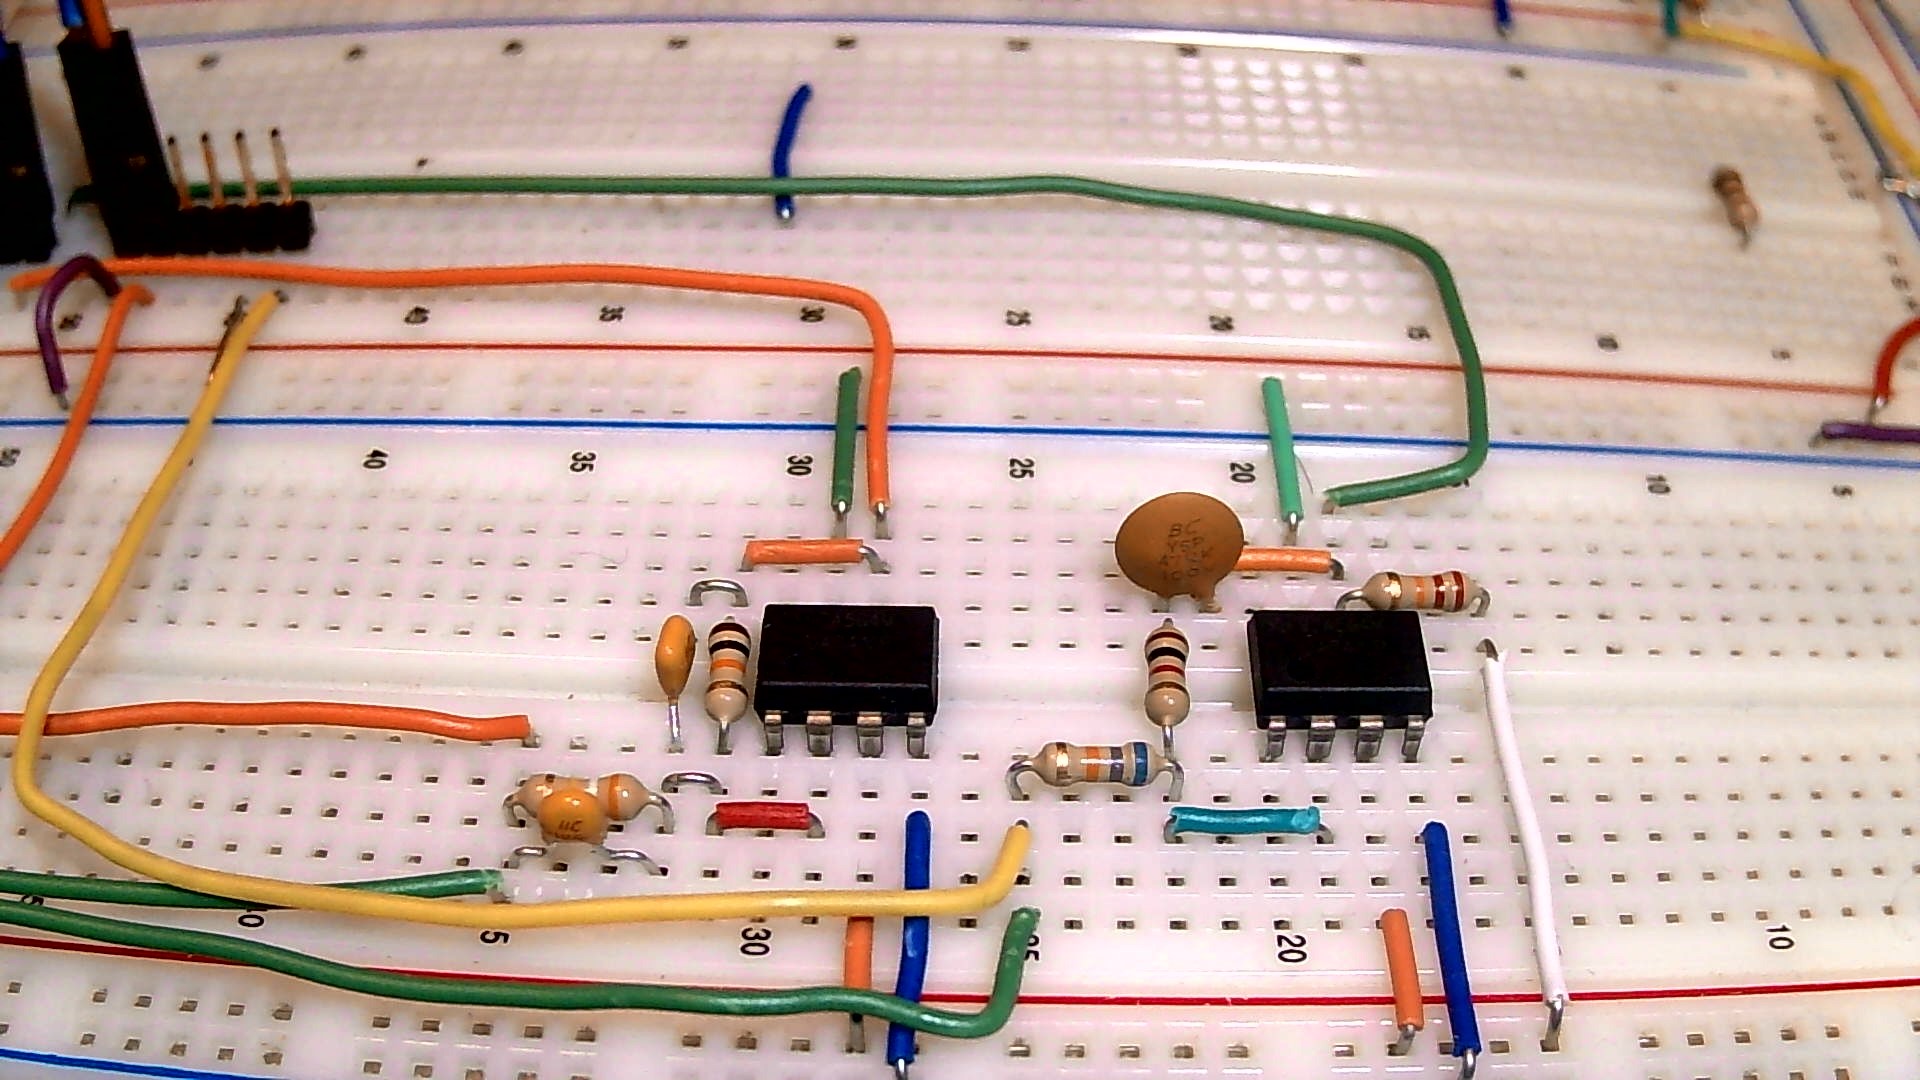
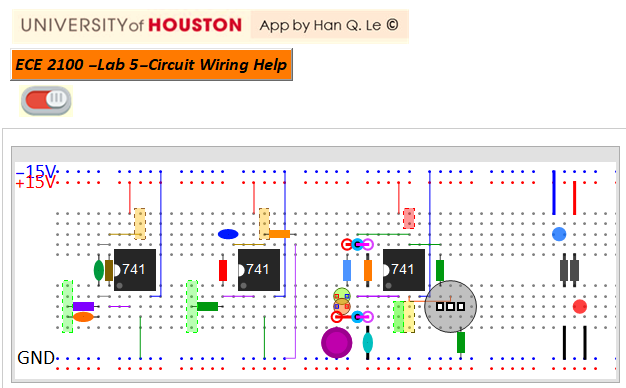
Circuit wiring
Step 2 to Step 5 work plan
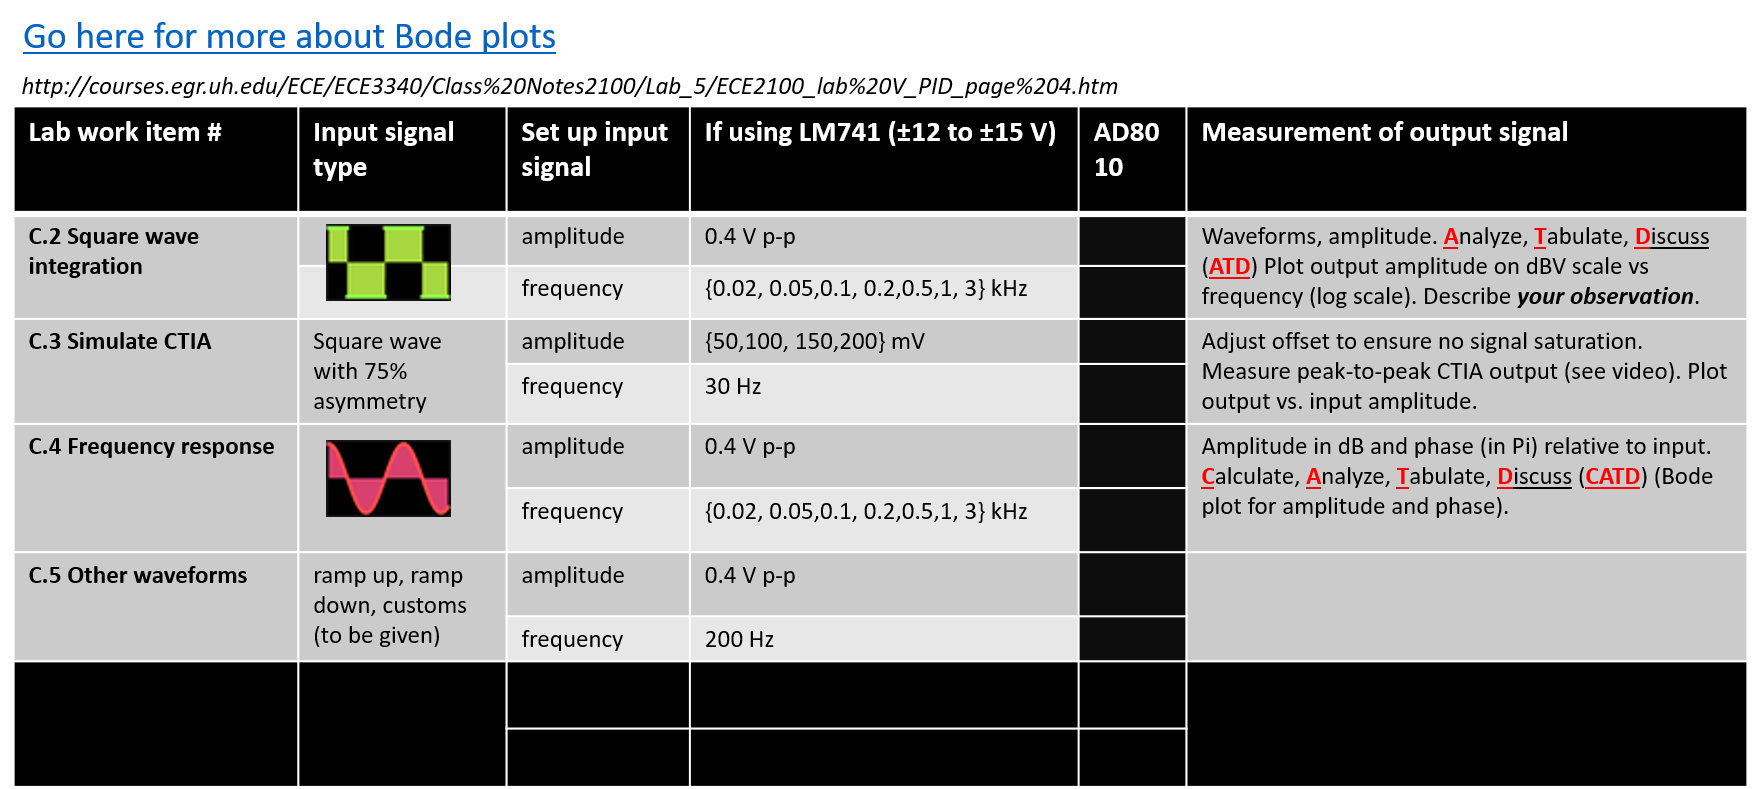
Step 2: Test basic integration with a square wave
The integration of a constant is a linear slope. Input a square wave and expect a saw tooth, or triangle. See video for details.
It is recommended that you use AC coupling output as in the picture below. This is also explained in the video.
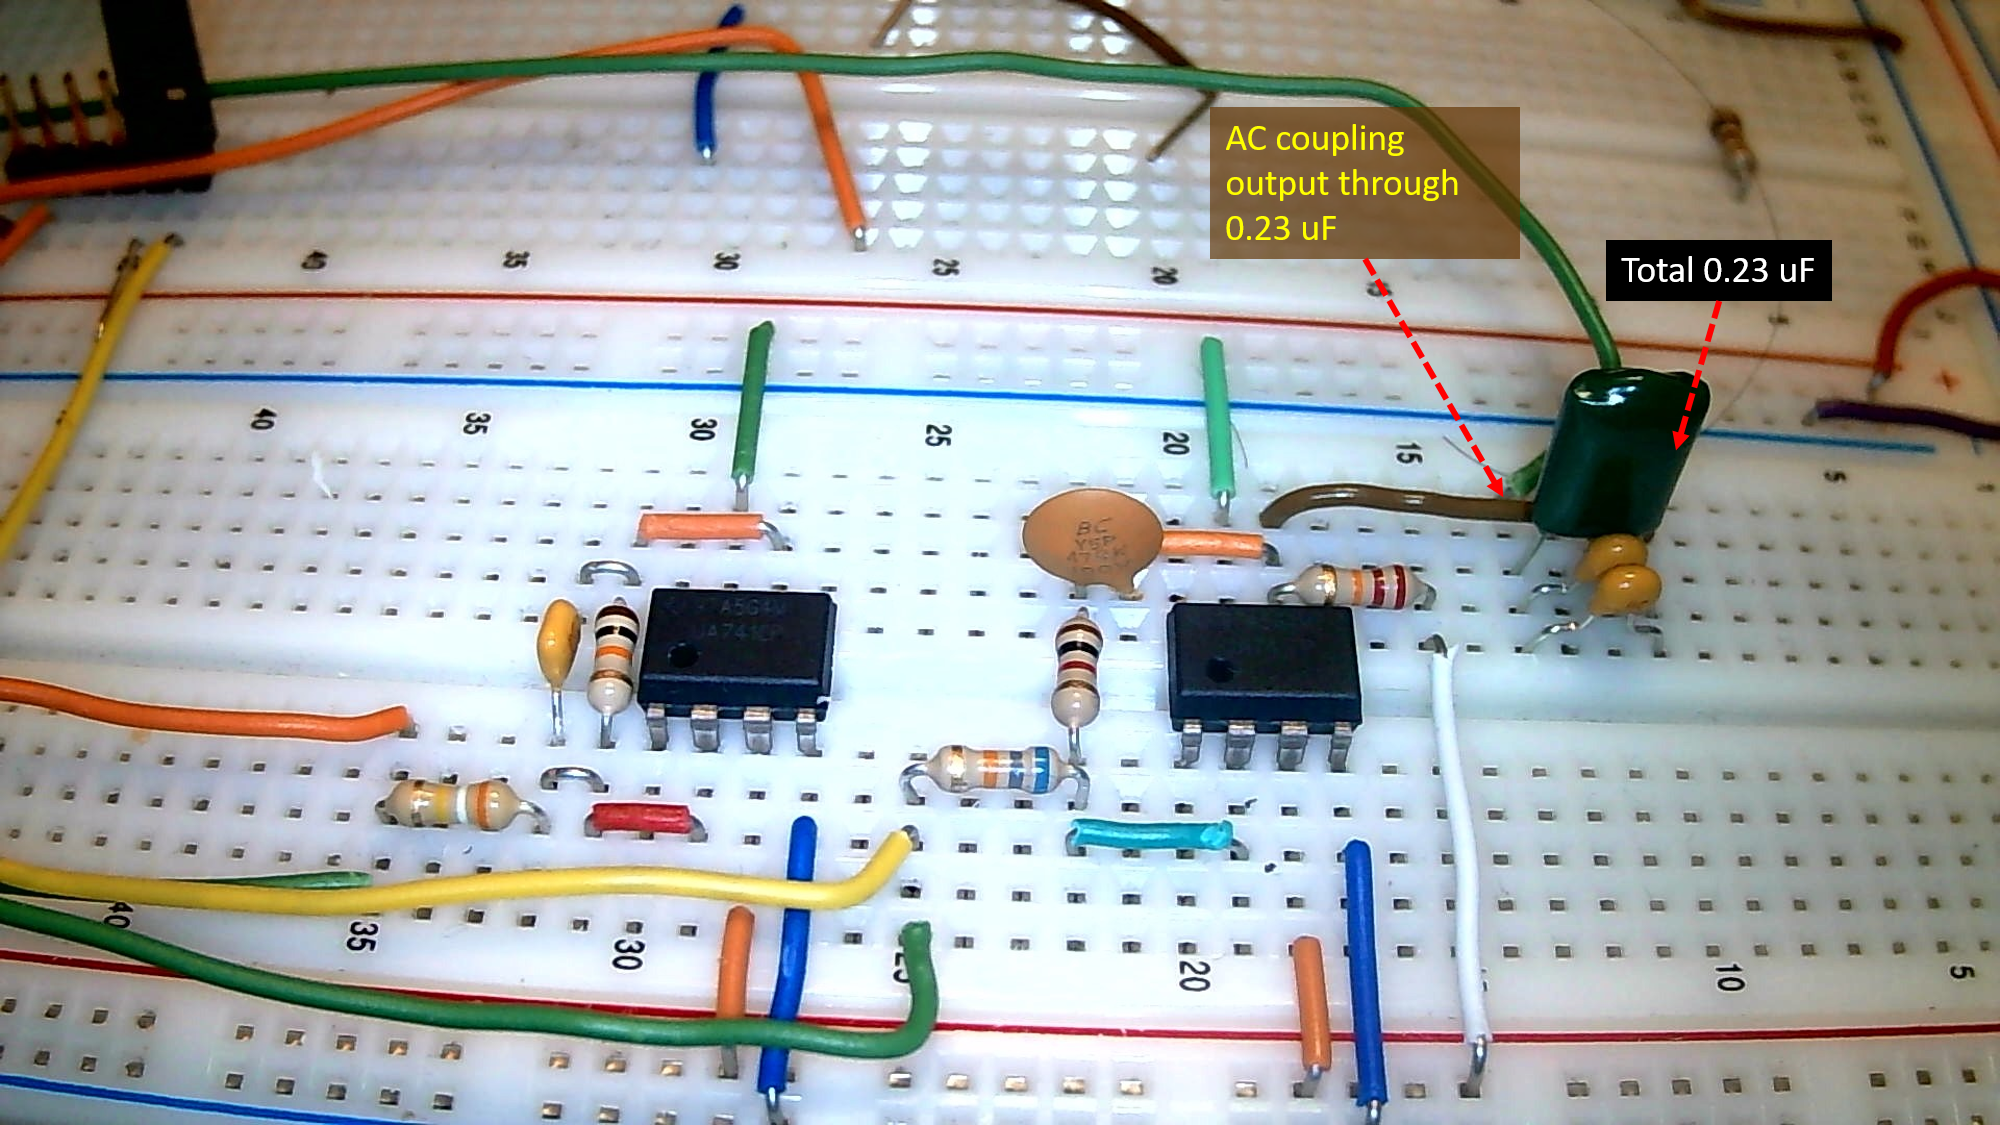
Follow the work plan above to do measurements and analysis.
Step 3: Simulating a capacitive transimpedance amplifier
Review this note from Lab 4
Please see video below for instruction if necessary. Be sure to avoid op am saturation.
Follow the work plan above and instructions in the video to do measurements and analysis.
Step 4: Frequency response. Observe the low-pass filtering behavior
Important: Avoid Digilent AD2 phase calculation error.
Bode plot for phase will make no sense because of Digilent error. The error is reduced, but not negligible even with AC coupling. Use the approach described in the link, or save the data and calculate the phase with other software. The Network function of Digilent Waveforms package yielded distorted and erroneous Bode and Nyquist plots for both magnitude and phase for unknown reasons. The key point is take the safest route: save data in .csv files and analyze externally.
The Bode plots below are for a circuit with its R, C components having certain nominal values. They are for illustrative purpose only. Use the circuit simulation app
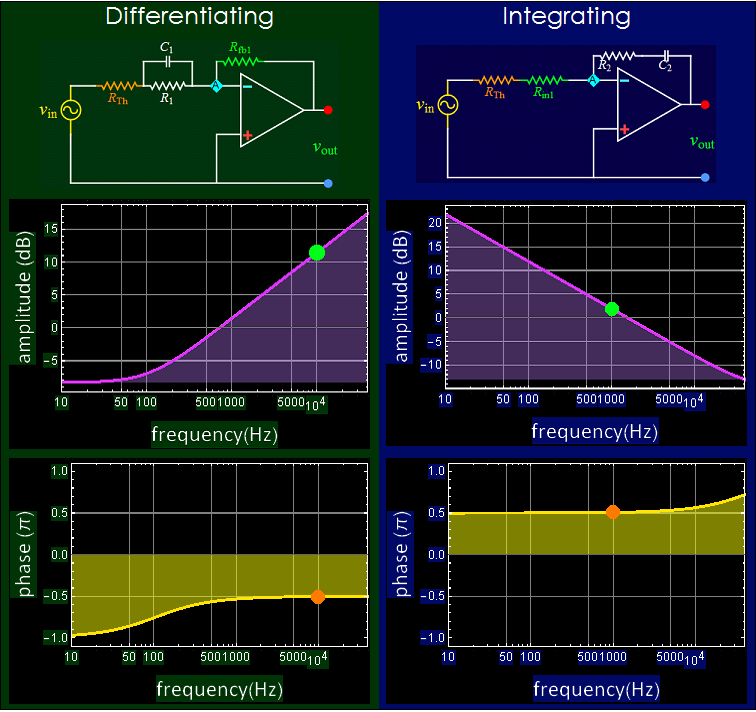
Follow the work plan above to do measurements and analysis. Use the software from Lab 4 if necessary.
Step 5: Test other waveforms.
Follow the work plan above to do measurements and analysis.
Complete your report with all the evidence of your work, from circuit to measurements, analysis, and multimedia evidence if you provide links. Do NOT embedded large audio-video files in your report. It is your responsibility to ensure that the links to your multimedia files work.
End of Part C
End of
Lab 5